
Google AI Overview Presence in 2026: Retail vs. Financial Services

Bottom Line
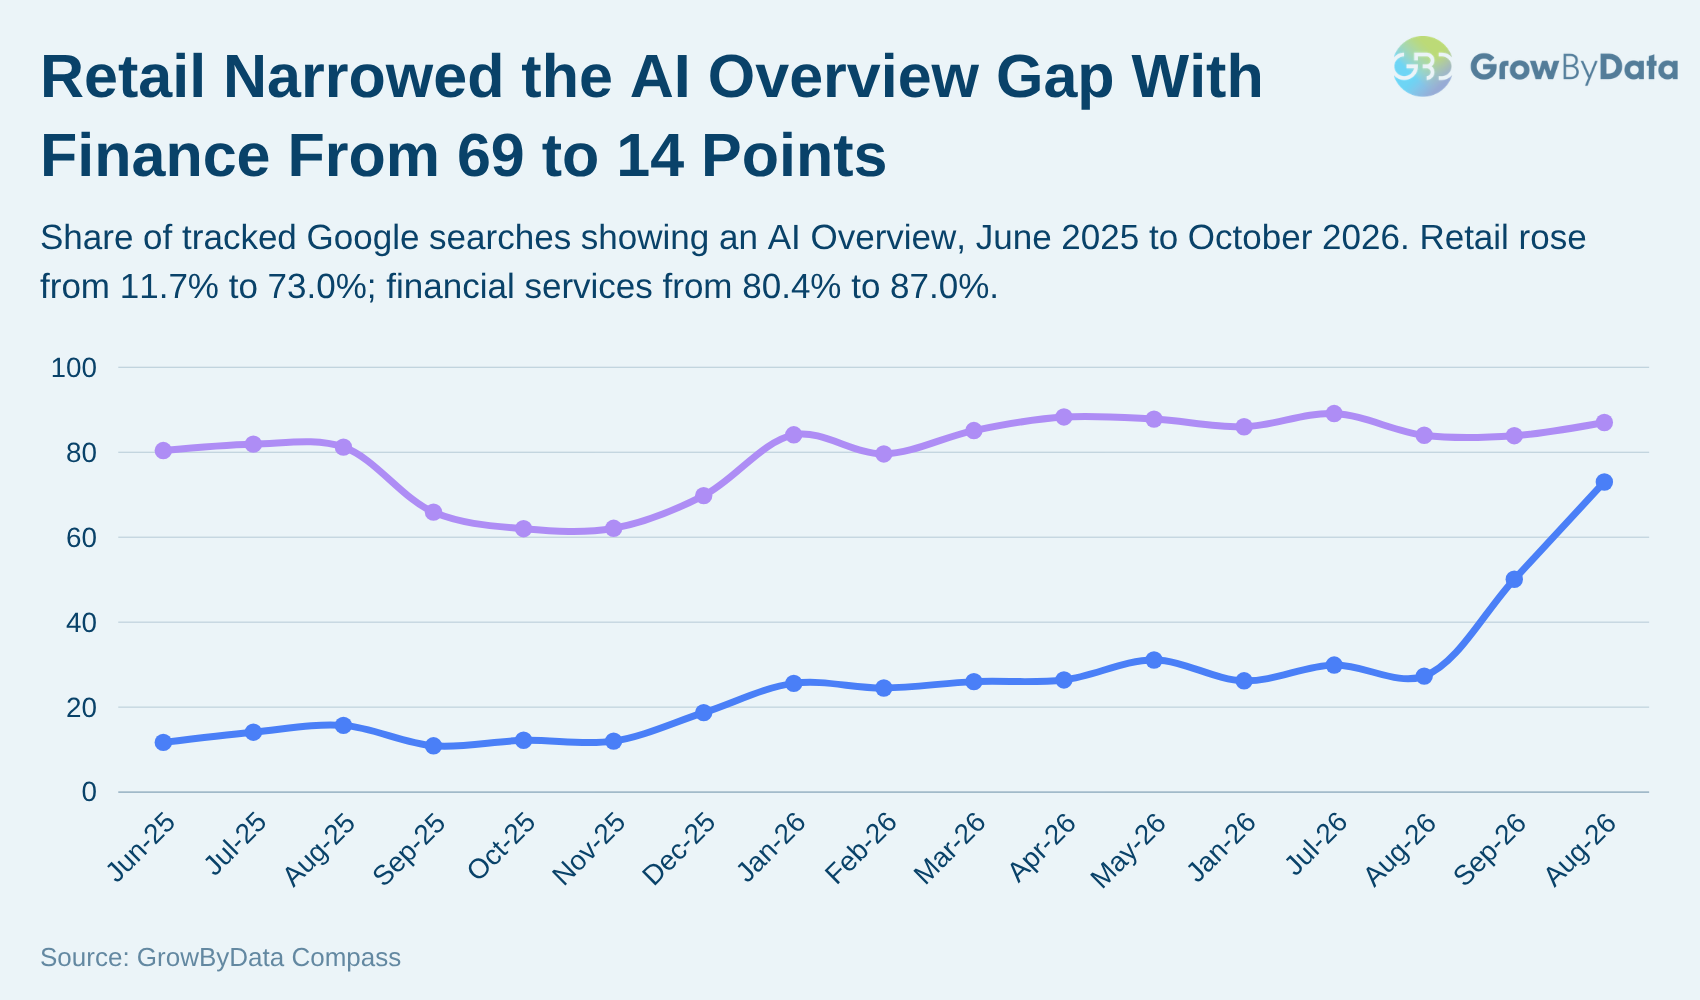
In the retail searches we track, Google AI Overviews went from 11.7% of results pages in June 2025 to 73.0% in October 2026, closing most of the gap with financial services at 87.0%.
Google AI Overview presence rose sharply across the retail and financial services searches we monitor, but the two industries got there on different schedules. In June 2025, AI Overviews appeared in 11.7% of tracked retail search observations and 80.4% of financial services observations. By October 2026, those rates were 73.0% and 87.0%.
Key Findings
- The gap shrank from 68.7 to 14.0 points. Retail went from 11.7% to 73.0%; financial services went from 80.4% to 87.0%.
- Retail’s catch-up came late. Most of it happened in September and October 2026.
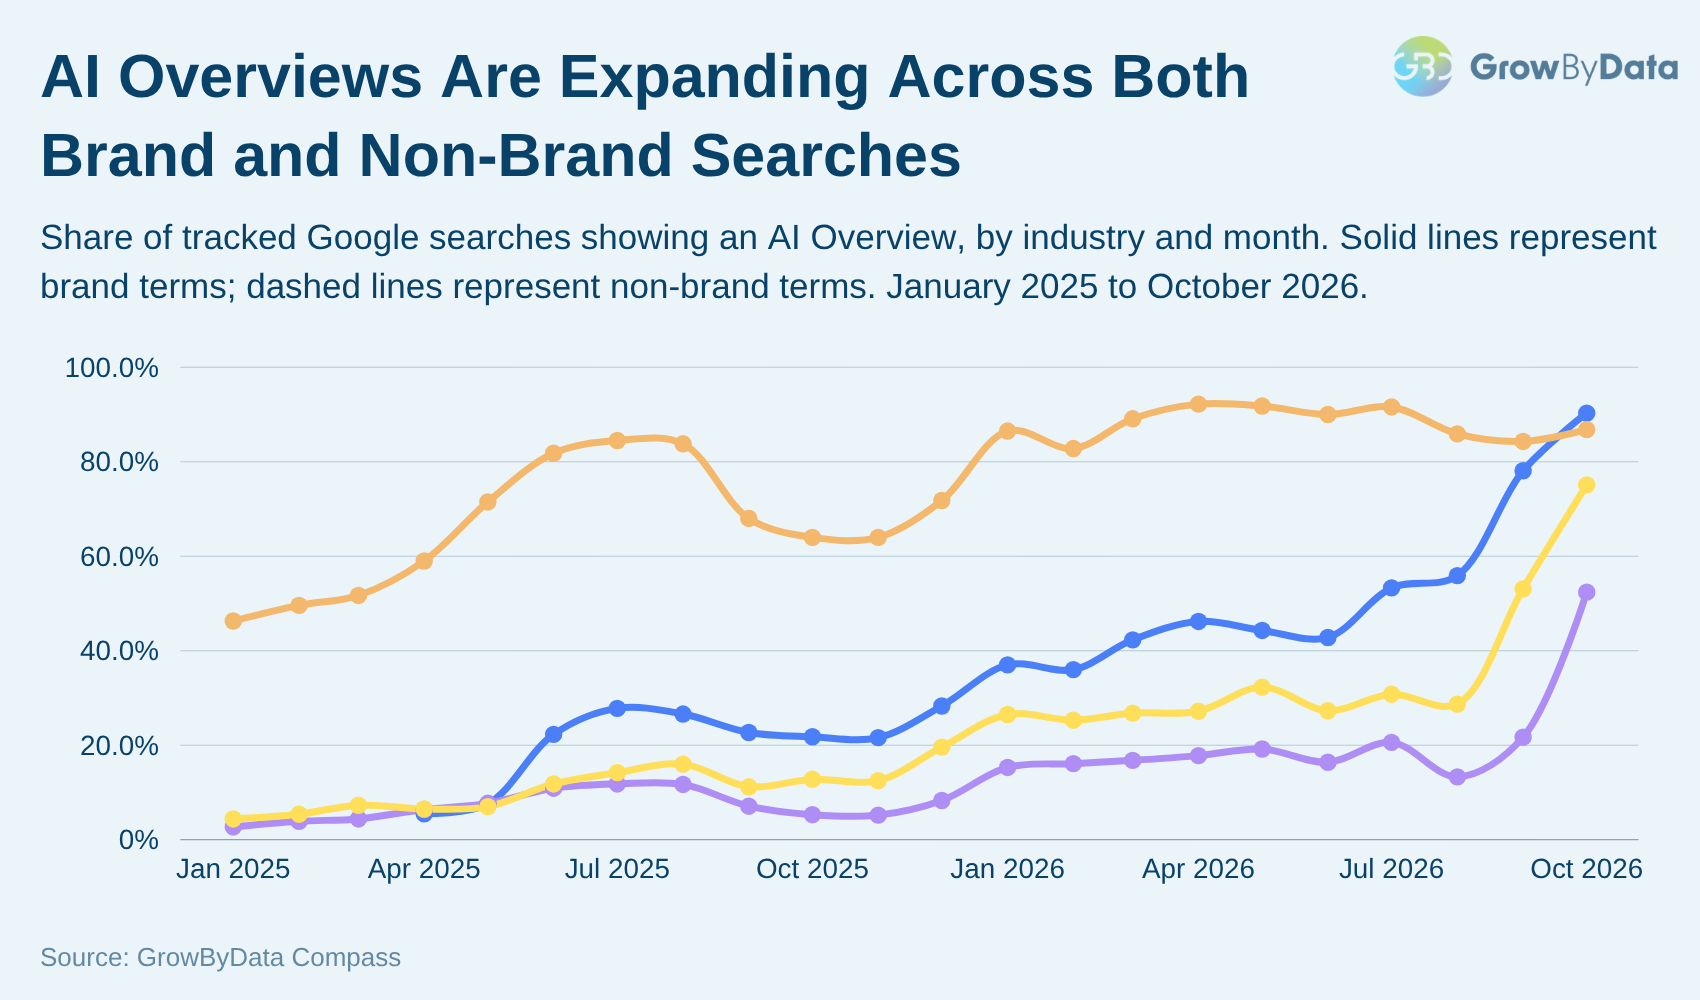
- Branded searches moved too. AI Overviews on retail brand terms went from 13.3% in August 2026 to 52.4% in October.
- Growth wasn’t steady. Both industries dipped in late 2025, then climbed again.
Retail vs. Financial Services: The AI Overview Gap Shrank From 68.7 to 14.0 Points
Financial services started far ahead. Retail stayed below 32% every month through August 2026, then caught up fast in the last two months of the study.
| Industry | June 2025 | October 2026 | Change |
|---|---|---|---|
| Retail | 11.7% | 73.0% | +61.3 points |
| Financial Services | 80.4% | 87.0% | +6.6 points |
In October 2026, the retail rate came from 307,416 tracked search observations and the financial services rate from 66,342. These are selected keyword sets, so the figures describe monitored results, not every search in either industry.
For retail teams, AI Overviews now appear on most of the searches we track. If that’s your category, here’s how to track AI Overviews on shopping and product searches by query, device and market.
Are AI Overviews Changing Your Search Visibility?
The Timing: Retail Went From 27.3% to 73.0% in Two Months
Growth came in waves. Both industries pulled back in late 2025, then recovered:
- August to November 2025: retail fell from 15.7% to 12.0%, and financial services fell from 81.2% to 62.1%.
- January 2026: both were back up, at 25.6% for retail and 84.1% for financial services.
- August to October 2026: retail jumped from 27.3% to 50.1% to 73.0%, while financial services moved from 84.0% to 87.0%.
The two industries changed in the same windows, which is worth investigating. These figures alone don’t prove a Google-wide update caused it.
Google was also changing what goes inside an AI Overview during this period. On September 23, 2026, Search Engine Roundtable reported third-party data showing a sharp rise in the share of AI Overviews that include external links. On October 15, Google said it had made “continued and substantial increases to the presence of inline links” in its AI Mode and AI Overviews updates.
Those changes are about the links inside an answer, not how often an AI Overview appears, so they don’t explain our presence numbers. They do point to the next question. Once AI Overviews show up on most of your searches, what matters is whose pages they link to.
Branded Searches: Retail Brand Presence Rose 39.1 Points in Two Months
The industry averages hide a split by search type. Non-brand searches had high AI Overview presence earlier, especially in financial services. Branded searches caught up later.
| Industry | Search Type | August 2026 | October 2026 |
|---|---|---|---|
| Retail | Brand | 13.3% | 52.4% |
| Retail | Non-Brand | 28.7% | 75.1% |
| Financial Services | Brand | 55.9% | 90.3% |
| Financial Services | Non-Brand | 85.9% | 86.8% |
Retail brand searches climbed 39.1 points from August to October, but still trailed retail non-brand searches by 22.7 points.
Financial services looked different. Branded presence reached 90.3% in October, above the 86.8% non-brand rate. That branded series comes from only one monitored keyword set, so don’t treat it as an industry-wide benchmark.
What Search Teams Should Take From These Findings
- Report industry and search type separately. A blended percentage hides both the retail vs. financial services gap and the brand vs. non-brand split.
- Don’t confuse presence with visibility. An AI Overview appearing doesn’t mean your domain was cited. Presence is only the first layer of AI search visibility; check citations, competing domains, and placement next.
- Know what Google requires. Google’s guidance on AI features and your website says there are no extra requirements to appear in AI Overviews beyond being indexed and eligible to show with a snippet. Which pages get cited comes down to Google’s choice for each query.
- Check keyword coverage before reading trends. Retail added a third monitored keyword set in April 2026, and coverage also changed within other sets. Isolating Google’s behavior would need a fixed-keyword comparison.
To track presence and citations on your own searches, see our Google AI Overviews monitoring solution. For background on the feature itself, read our guide to Google AI Overviews.
Methodology and Limitations
Source: GrowByData Compass data for five selected monitored keyword sets: three retail and two financial services sets by October 2026. The industry comparison runs from June 2025 to October 2026. The search-type chart goes back to January 2025 where data exists.
Metric: AI Overview presence equals tracked SERP observations containing an AI Overview divided by all tracked SERP observations in the same industry, search type, and month. AI Overviews are one of several Google SERP features we track; this study measures only whether one appeared. Desktop and mobile observations are pooled, and results are rounded to one decimal place. These percentages don’t measure search volume, clicks, citations, or the share of every Google search that contains an AI Overview.
Coverage: Two retail sets and two financial services sets were active in June 2025; a third retail set began in April 2026. The financial services brand series starts in April 2025 and comes from one tracked set. Keyword composition changed during the period, so these results are descriptive and don’t establish causation.