
AI search visibility metrics are the numbers that tell you whether your brand is actually winning inside ChatGPT, Perplexity, and Google’s AI surfaces, not just occasionally getting lucky. Most teams stop at one metric: did we get mentioned. That tells you almost nothing on its own, the same way knowing your domain shows up somewhere in Google tells you nothing about whether anyone clicked.
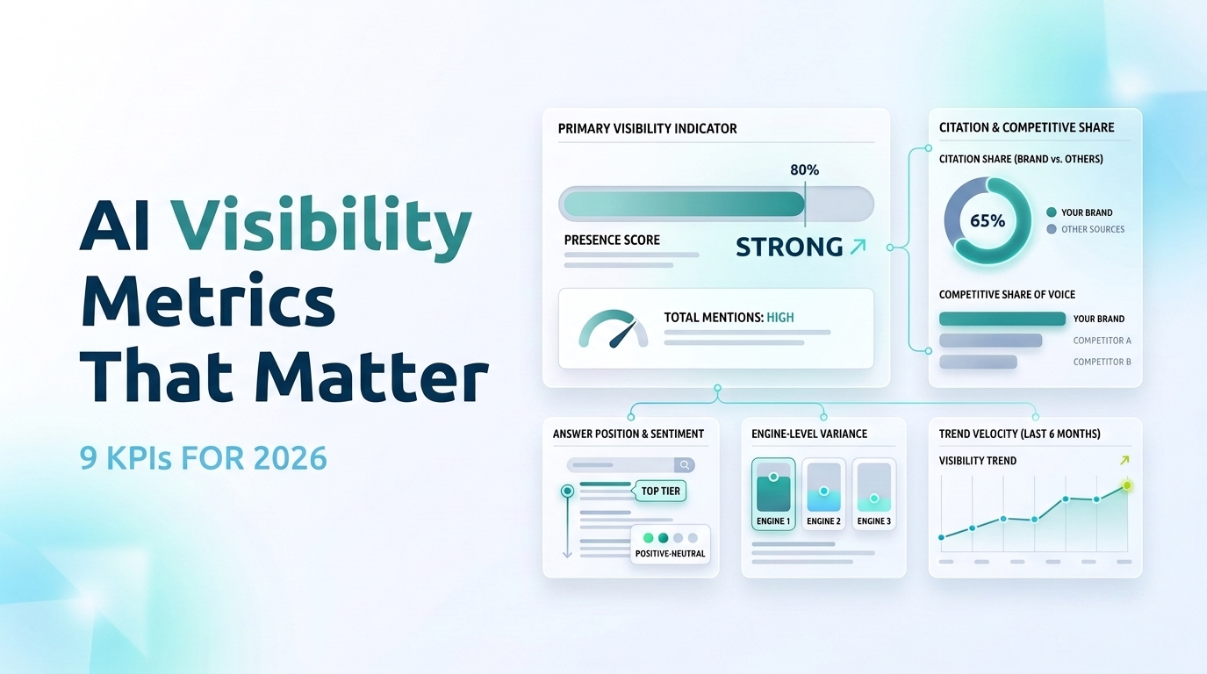
Below are the nine KPIs worth building a dashboard around, grouped into three questions: are you visible at all, how do you show up when you are, and what is that visibility actually worth. Presence and citation share come first. The other seven are refinements layered on once those two have a real baseline, not a replacement for them.
Why bother at all: AI-assisted search now accounts for a majority of global search activity when every engine is combined, by some 2026 estimates north of 55 percent, and Google’s own AI Overviews alone reach roughly half of all searches. A metrics framework built for ten-blue-links SEO was never designed for a channel that size, and bolting a rank-tracking mindset onto it is where most dashboards quietly go wrong.
Key takeaways
- Presence and citation share come first. The other seven KPIs refine a baseline, they don’t replace it.
- A KPI moving is not automatically good news. Independent weekly tracking from SISTRIX and BrightEdge both found that when citation share shifts, it’s a loss far more often than a gain, which is why Visibility Velocity has its own line on this list.
- Track engine-level variance separately. ChatGPT, Perplexity, and Google AI Mode retrieve differently, and a blended average hides the gap you need to see.
- “Did we get mentioned” is not a metric. It’s the AI-search equivalent of judging SEO on whether your domain shows up anywhere in Google, with no regard for position or clicks.
- Report weekly internally, monthly to stakeholders, so trend velocity is visible before a budget conversation, not after one.
What metrics actually measure success in AI search?
Nine, across three questions: whether you show up, how you show up when you do, and what that visibility is worth to the business. Each group builds on the one before it. There’s little value in refining sentiment accuracy for a brand that’s only present on one prompt in five.
The first three KPIs answer one question: are you visible at all? Nothing past this group matters much if the answer is no.
1. Brand Visibility (Presence Rate)
The percentage of tracked prompts where your brand appears at all, cited, named, or described. This is the floor metric. Say a Senior SEO Manager at a mid-market home goods retailer pulls this number for the first time and finds the brand present on 38 of 120 tracked prompts, a 32 percent presence rate. That’s not a KPI to optimize yet. It’s the baseline everything else on this list gets measured against.
2. Prompt Coverage Breadth
How many distinct, buyer-intent prompts you’re actually tracked against, not just how many favorable ones a team already watches. Fifteen cherry-picked prompts where the brand happens to do well is a highlight reel, not a category. A team that only monitors the prompts it already wins never sees the gap opening up right next to it.
3. Engine-Level Variance
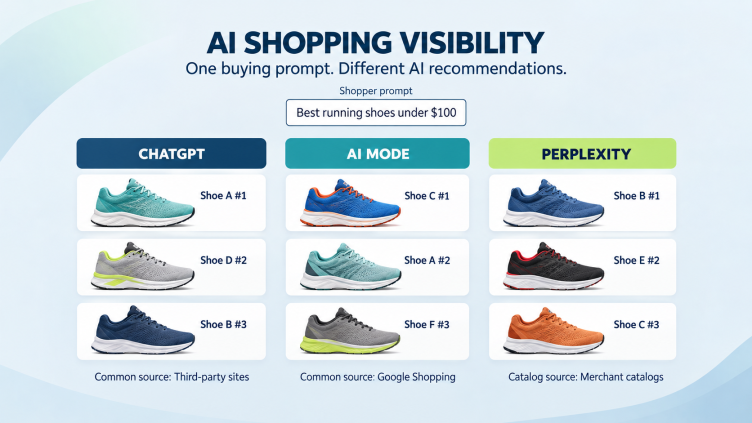
Presence and sentiment on ChatGPT versus Perplexity versus Google AI Mode can differ sharply, since each engine retrieves and weights sources differently. Blend them into one number and the gap disappears. Say a brand’s numbers land at 54 percent presence on ChatGPT, 61 percent on Perplexity, and 19 percent on Google AI Mode. Averaged together, that’s a forgettable 45 percent, a number nobody would escalate. Reported separately, the AI Mode gap is the one that should worry a Director of SEO most, because AI Mode sits directly inside the Google results page the brand’s actual buyers are already searching from.
The next three answer a harder question: when you do show up, how well? Presence without quality is a vanity metric with extra steps.
4. Citation Share
Of the prompts where you’re present, how often your domain is actually linked or named, versus just referenced in passing. A model can describe a product accurately and never cite the source, which means zero traffic back to the site no matter how flattering the description was.
5. Answer Position
Named first, or buried third in a list of five. Position correlates with perceived credibility much the same way it does in organic search, even without a literal ranking algorithm behind it. A brand cited third in an AI Overview answer, after two named competitors, reads to the buyer as the third choice, whether or not that reflects reality on the ground.
6. Sentiment Accuracy
Whether the AI’s description is current and accurate, or repeating outdated pricing, a discontinued feature, or a stale, unflattering comparison against a competitor. This is the metric that catches reputational risk before it becomes a sales objection. A VP of Product Marketing finding out that ChatGPT is still quoting last year’s pricing tier, three months after a repricing, is not a minor data hygiene issue. It’s quietly costing deals in a channel with no obvious feedback loop to flag it.
The last three tie visibility back to competitive standing and business value, the numbers that actually justify continued budget.
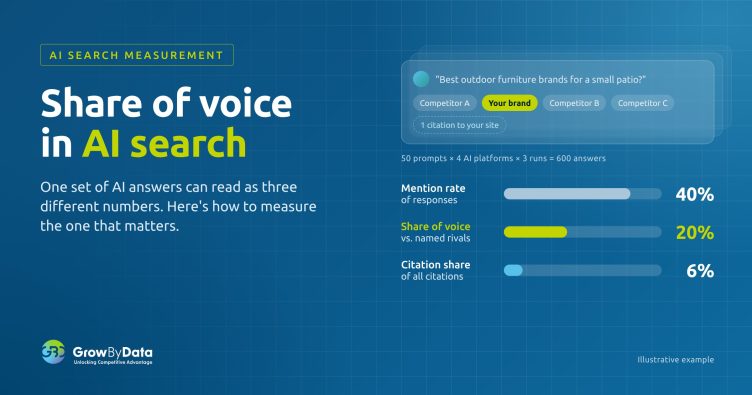
7. Share of Voice Against Named Competitors
Run the same prompt set against your top three to five competitors. Sixty percent presence looks fine in isolation. It reads very differently next to a competitor sitting at ninety, on the exact same prompts, in the exact same category.
8. Visibility Velocity
Presence and citation share are snapshots. Velocity is the week-over-week rate of change, and it earns its own line on the dashboard because a snapshot alone hides how unstable AI citations actually are. SISTRIX’s AI Research Index, built on roughly 1.5 million weekly snapshots across six countries between December 2025 and April 2026, found citation drift running 54 to 59 percent every single week across Google AI Overviews, Google AI Mode, and ChatGPT Search, with no sign of settling down over the study period. Separate weekly tracking from BrightEdge found something worth sitting with: on the small share of cited domains that do shift week to week, the move is a loss roughly seven times more often than it’s a gain. A citation win one week is genuinely good news. It isn’t, on its own, a trend, and treating it like one is how teams get blindsided by a slide they should have caught three weeks earlier.
9. Citation-to-Click Correlation
Where analytics allow it, tie AI referral traffic back to the specific prompts and pages that actually drove a visit. This turns AI visibility from a vanity report into an attributed channel, and it’s the metric most dashboards skip, because it’s the hardest one to build. It’s also the one that finally answers the question a CFO actually asks: so what.
What Does AI Really Say About Your Brand?
AI engines are already influencing buying decisions. Find out how your brand is represented.
How do you turn nine numbers into one scorecard?
Nine metrics on nine separate spreadsheet tabs is how a tracking program quietly dies. The point of grouping them is a single scorecard, reviewed on a cadence that matches how fast each number actually moves.
| KPI | What it answers | Check it |
|---|---|---|
| Brand Visibility | Are we present at all? | Weekly |
| Prompt Coverage Breadth | Are we tracking the real category, or a highlight reel? | Monthly |
| Engine-Level Variance | Which specific engine is the weak point? | Weekly |
| Citation Share | Are we linked, or just described? | Weekly |
| Answer Position | Named first, or buried? | Monthly |
| Sentiment Accuracy | Is the description still true? | Monthly |
| Share of Voice vs. Named Competitors | Are we winning the category or just present in it? | Monthly |
| Visibility Velocity | Is this week’s number a trend or noise? | Weekly |
| Citation-to-Click Correlation | What is this actually worth? | Quarterly |
Which of these KPIs should you prioritize first?
Presence rate and share of voice, full stop. Everything else here refines a program that already knows whether it’s visible at all. Optimizing sentiment accuracy before establishing a baseline presence rate is building the second floor before the first.
Where teams get this wrong: they inherit a rank-tracking-shaped metric from their SEO stack and force it onto AI search because it’s familiar. There’s no fixed position ten results long, no guaranteed placement for a given prompt on a given day. A KPI framework built for AI search has to account for that variability, not average it away, which is exactly what Visibility Velocity is built to catch.
For the broader framework these KPIs plug into, our AI search visibility guide covers the full picture, and best LLM visibility tracking tools for enterprise is the natural next stop once you know what you’re trying to measure. For proving value to a budget owner, see how enterprises measure ROI from AI search visibility.
Frequently asked questions
What’s a good presence rate benchmark to aim for?
It depends on category maturity and competitive density, so treat any flat percentage online with suspicion. A more useful benchmark is relative: close the gap against your top two or three named competitors within a defined prompt set, rather than chasing a number some blog post decided was universal.
Do these KPIs apply the same way to Google AI Overviews as they do to ChatGPT?
Mostly, with one adjustment. AI Overviews sit inside a search results page, so citation and position data often ties directly to keyword-level Search Console data, which is harder to replicate for ChatGPT or Perplexity, since neither has an equivalent first-party reporting layer.
Is one week of citation share movement worth acting on?
Usually not by itself. Weekly tracking from BrightEdge found that the overwhelming majority of cited domains, north of 96 percent, see zero change in a given week, and among the small share that do move, most of that movement is downward. One data point is noise. The same direction two weeks running is a signal worth escalating.
How often should these metrics be reported internally?
Weekly for the team running the program, monthly for stakeholders. Weekly catches sudden swings from a model update or a lost citation. Monthly shows trend velocity clearly enough to justify continued investment, without drowning a VP in noise they don’t need to see.
Do we need to track all nine by hand?
Not realistically, past a handful of prompts. Presence, citation share, and engine-level variance are the three that punish manual tracking hardest, since they require running the same prompt set repeatedly across multiple engines on a fixed schedule. Most teams that try to do this by hand quietly stop after a month or two, right around when the data would start getting useful.
Get these nine metrics tracked automatically, not pieced together by hand
See how GBD Compass builds this scorecard on your actual prompt set and keyword list, including visibility velocity, without a spreadsheet holding it together.