The latest update to our dashboard, Holistic Search Explorer, is made in a way that allows SEO and SEM teams to leverage the information and insights to gain a better understanding of their Total Search Performance on the Google SERP. This new dashboard makes it easier for teams and Search Managers to easily gain insights into their Google SERP Performance.
In this article, we will go through what each view provides, what kind of insights you can gain from each view, and how those insights can be leveraged to increase your holistic visibility on the search engine result page.
Table of Contents: Show
Holistic View
The holistic view is meant for Search Managers who aren’t looking to drill down super deep into the data, just getting a bird’s eye view of the SERP features in 2022 and the competitive landscape within the Google SERP.
SERP Insights
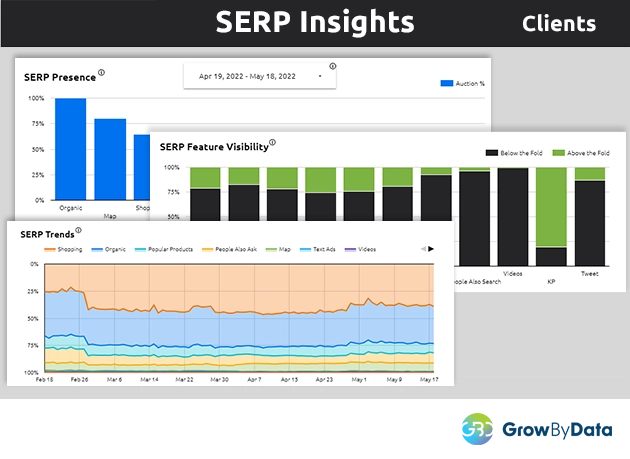
GrowByData Search Intelligence Software tracks and analyzes the SERP data to give you SERP Insights that show you what the SERP looks like during a certain time period for a keyword or a list of keywords. There are three graphs within this view.
- SERP Presence – This shows how often each type of SERP feature appears on the SERP. This can tell you what kind of feature is most prominent for the keyword during a certain time period. This allows you to see the most commonly found SERP features.
- SERP Feature Visibility – This graph shows you which SERP features are showing up above the fold and which ones are showing below the fold. This gives you a sense of not only how common a SERP feature is, but also how prominent and visible these features are, and what kind of real estate they are taking up.
- SERP Trends – The SERP trends graph allows you to see the composition of the SERP over time. You can see which feature is gaining in popularity and which ones are declining. This also shows you how the format of the SERP has been changing over time. You can gain insight into which features are emerging and which ones are disappearing over time.
These views allow you to see what kind of SERP features are appearing on the SERP, giving you an idea of what type of SERP might be important for you to appear on. It also tells shows you the emerging feature over time, which means you could get a jump on your competitors on emerging SERP features to gain visibility in the future.
Competitive Landscape
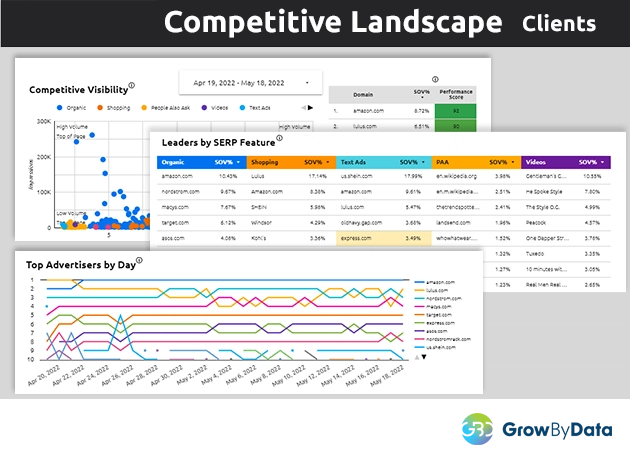
The competitive landscape view gives you a high-level view of where your competitors rank on the SERP, the Share of Voice of your competitors on the keywords, as well as the movement of the advertisers in your category.
- Competitive Visibility – Compares the volume and position of SERP features listed by each domain. This allows you to see the different types of domains showing up and who is showing up on each of those features, giving you the Share of Voice of each domain.
- Leaders by SERP Feature – This list shows you the top 10 competitors based on each SERP feature. The domains are ranked based on the digital Share of Voice for that specific feature.
- Top Advertisers by Day – This graph shows you the trend of the advertisers based on the volume of times they are showing you each day. It can help you see which advertisers are gaining in popularity (new emerging competitors) versus which ones are lagging.
This view gives you a high-level makeup of the competition and where competitor’s ads are appearing, who the leaders in each SERP are, and which advertisers are advertising the most during a certain time period.
Organic Trends View
For those interested in improving their SEO, this bundle provides visibility into your keywords, SERP features, competitive landscape, and category insights based on organic results on the SERP.
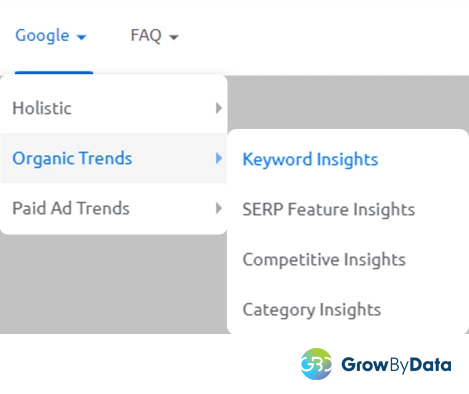
Organic Trends – Keyword Insights
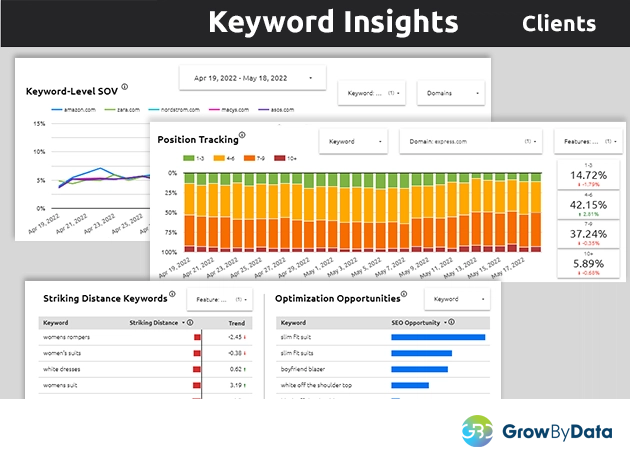
Keyword insights give you all the information you’re looking for, at a keyword level. It shows you the Share of Voice of brands and advertisers in your category over time for a specific keyword. You can also look at the Share of Voice over time of specific domains that are of interest to you.
The position tracking graph shows you where your listings rank for keywords over time. You can see if the positions of your listings are improving over time or not based on the trend of real estate your keywords are covering. This tells you which keywords need to be improved or optimized and which ones are already performing well.
This view also gives you striking distance keywords and optimization keywords. Striking distance keywords are those that show up on the first page but are “Below the Fold”. These are the keywords you can optimize for SEO in order to get above the fold and quickly boost your visibility. Optimization opportunity keywords are keywords that you have the best chances of gaining visibility “Above the Fold” by merely improving your SEO, without any ad spend.
Organic Trends – SERP Feature Insights
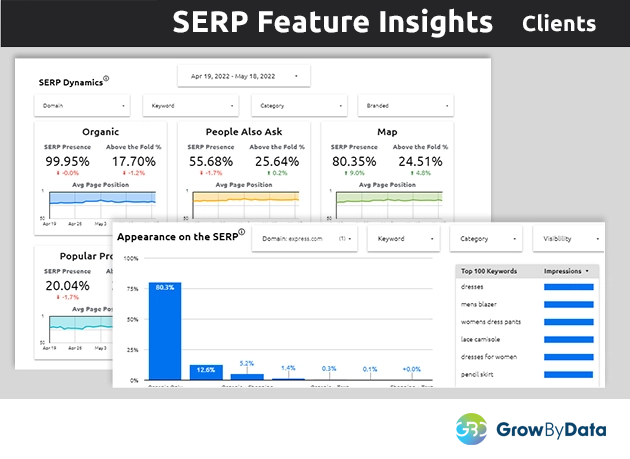
SERP Feature Insights go a bit deeper into your organic SERP dynamics to track the presence and visibility Above the Fold. It also shows which features are increasing over time and which ones are on the decline which is helpful for businesses to pivot their campaign strategies to show up on the emerging features and get out from the declining features. You can filter the results based on keywords, domains, and categories.
This view allows you to see your footprint on the SERP across organic and paid formats. It tells you what features you are showing up the most for and which keywords you are getting the highest impressions on. Insights like these can be used in combination with the other views on the Holistic Search Explorer to strategize your campaigns.
Organic Trends – Competitive Insights
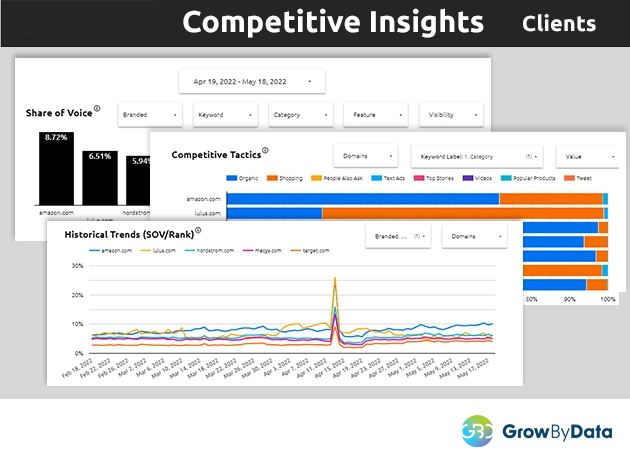
Competitive insights show you the Share of Voice (SOV) of competitors in your category. This can be filtered based on keyword, category, SERP feature, and whether it is showing up Above or Below the Fold.
It also allows you to see all the SERP features your competitor appears in for a particular category. This can help you see who you are competing with for each SERP feature and design targeted tactics to outperform competitors. The view also has historical trends of competitors’ Share of Voice giving you a peek into their performance on the Google SERP in the last three months.
Organic Trends – Category Insights
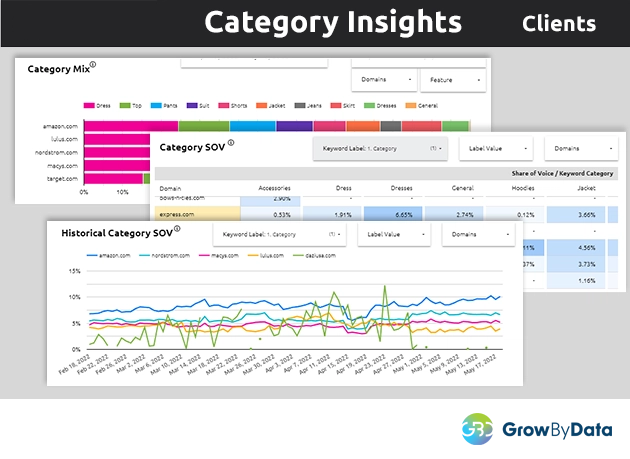
The category insight shows how the top domain’s listings are distributed across categories and it gives you the Share of Voice of the top 500 domains within those categories. Understanding who you are competing with and who the biggest players are within a specific category gives you a clearer sense of how you can plan for overtaking them.
For example, knowing lulus.com has 22% SOV in the dress category but only a 1% SOV in the jacket category means you can analyze what they are doing well for dresses to learn and create better content for it.
Paid Ad Trends
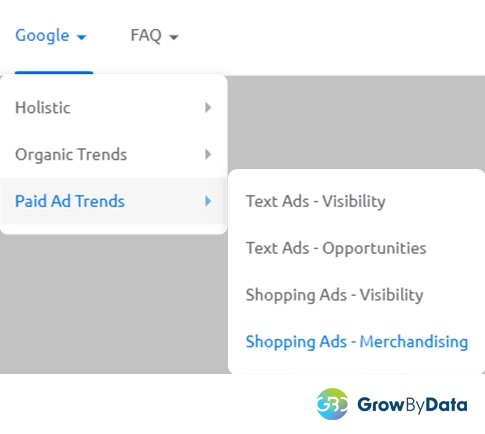
This view provides search teams that are looking to improve their SEM insights into their text ad visibility, opportunities within the text ads, and visibility into the shopping ad landscape with merchandising details on the usage of annotations, LIA, shipping information, pricing, ratings, and reviews.
Paid Ad Trends – Text Ad Insights – Visibility
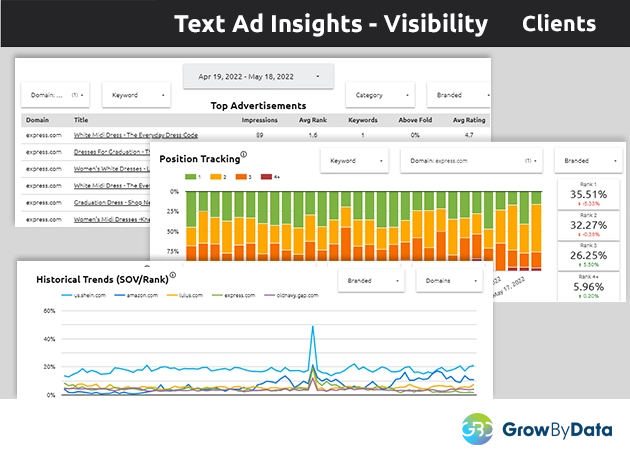
Text ad insights provide visibility into your text ad performance on the Google SERP. It tells you the impressions you are getting on each listing with the average rank over time, what is its Above-the-Fold visibility, and the rating of the listing. You can also view similar information on your competitors in each category and keyword.
This view also lets you track your position and your competitors’ positions on a daily basis for a keyword or a list of keywords. This can let you know whether your ad campaign strategies are working or not based on its movement on the SERP.
Paid Ad Trends – Text Ads – Opportunities
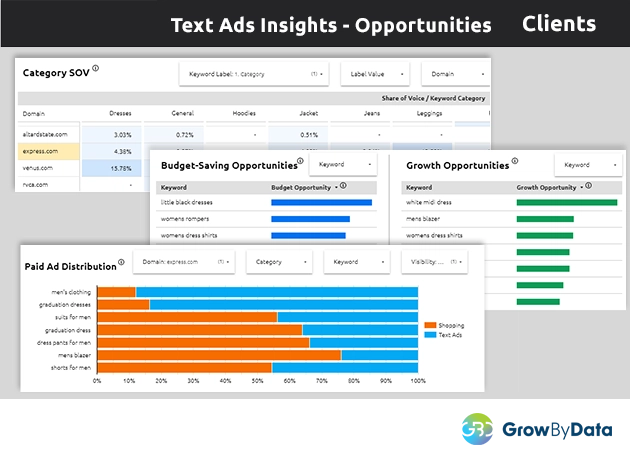
This view gives brands a look into the text ad SOV of you and your competitors in each category. Along with it, you get insight into keywords that have budget-saving and growth opportunities.
Budget saving opportunity keywords are those that you tend to appear organically for already and your text ads fall Below-the-Fold. You can use this information to trim your text ad spend since you have an organic presence. And growth opportunity keywords are those that you do not have organic or text ad visibility for. This means that you can target your text ad spend on these keywords to see the biggest boost in terms of visibility.
The view also breaks down the paid ad distribution for each keyword into shopping ads and text ads. Knowing which keywords are more popular for which type of paid ad allows you to make your paid ad strategies accordingly. If there are too many shopping ads for a keyword, then it may be difficult to rank on these and you may want to focus on text ads for them.
Paid Ad Trends – Shopping Ads – Visibility
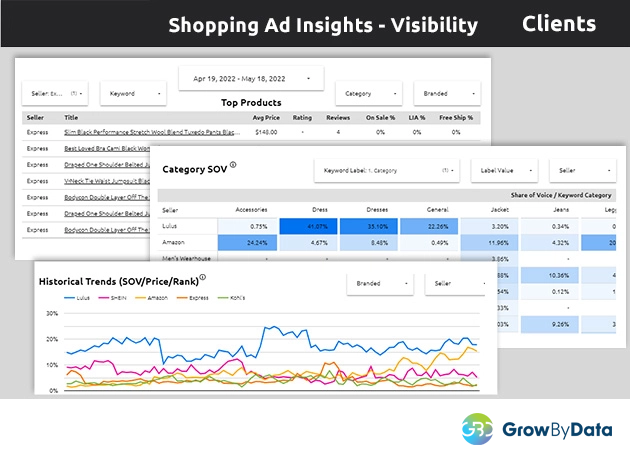
The shopping ad visibility insight view shows you the top products for a category and keyword. It gives additional information on each listing like the average price, reviews & ratings, how often the product was on sale, how frequently was free shipping offered on the listings, and if it had local inventory ads. This allows you to see what the top products are doing and what they might be missing, like no free shipping or low reviews. You can usurp those products by optimizing those features on your listings.
In addition, the view offers the shopping ad Share of Voice of the top 250 domains in each category along with the historical trends of the domains in the past three months. This gives you a clearer view of who has been increasing their shopping ad spending over time. It allows you to see emerging competitors in a category or keyword.
Paid Ad Trends – Shopping Ads – Merchandising
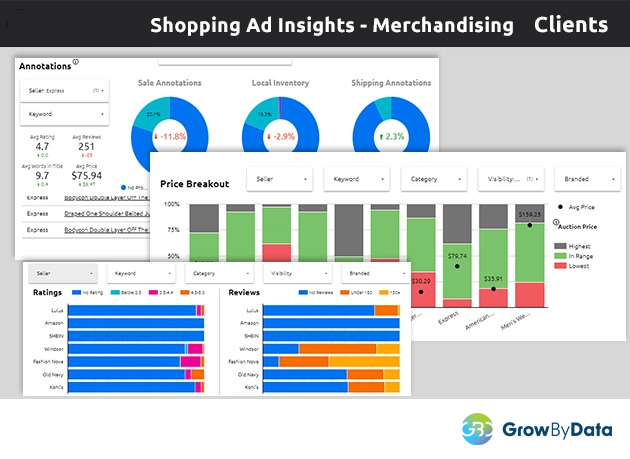
The shopping ad merchandising view gives you insights into each competitor’s usage of sale annotations, local inventory ads, and shipping annotations. It tells you if the average ratings and reviews of a seller are trending up or down.
You can dive deeper into the ratings and reviews by looking at them by category, keyword, and visibility Above or Below the Fold. This gives you information on the type of reviews and ratings needed in order to improve your Above-the-Fold visibility on shopping ads.
Price is a crucial part of a shopper’s buying decision. We broke down the shopping ad auction based on the price of the products on the auction. Comparing it to other prices in the visible carousel, are you above the highest price, below the lowest price, or within a close range of the average price on the auction. This visibility shows you who is running the ads for luxury products and who is running ads for budget products in each category. These insights allow you to have an advantage in terms of price for specific categories.
Conclusion
The Holistic Search Explorer serves brands, retailers, and agencies that are looking to improve their total search performance on the Google SERP. The information and insights from this dashboard can be leveraged by e-commerce businesses to optimize their SEO for their organic visibility and maximize their return on ad spend (ROAS) on their paid ads.
If you want to further understand what each graph is showing you and how each view could help your brand, then please schedule a demo where our experts will guide you through the entire dashboard and answer any queries you may have regarding it.


