Quality Score is a grading system which Google uses to rate the quality and relevance of an ad with the searched keyword. Google is always striving to improve the quality of the ads listed on their websites to improve the user experience. Quality score is a reflection of that.
Google strives to present ads which are most relevant to a user’s searches, resulting in more clicks on ads, and advertisers paying a cost per click (CPC) associated with that search. This helps Google’s advertising revenue. Google is also keen on presenting ads that have the highest probability to convert into sales for the advertiser, helping them maintain customer trust and loyalty, while allowing them more budget to spend on ads. Therefore, it makes sense for Google to show ads that are most relevant to a user’s search.
Quality Score is based on a scale between 1 and 10, where 1 is the lowest score and 10 is the best score possible. An ad’s Quality Score is an aggregated estimate of the overall performance in the ad auctions, showing advertisers how relevant Google believes their ad and landing page is for a specific keyword.
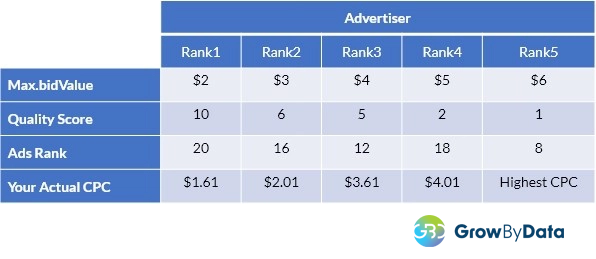
Another factor in ad performance on Google is Ad Rank. Per Google, “Ad Rank is a value used to determine your ad position (where ads are shown on a page relative to other ads) and whether your ads will show at all”. This rank is calculated from your max bid amount and Quality Score, which is calculated based on the following attributes:
- Your ad quality
- Expected click-through rate (CTR)
- Context of searches (like location, device, and time of the search)
- Other ads for that keyword
- Search results
- User signals/attributes
- Nature of search terms
- Landing page experience
- Expected impact of ads extensions and other factors
Why is Quality Score Important?
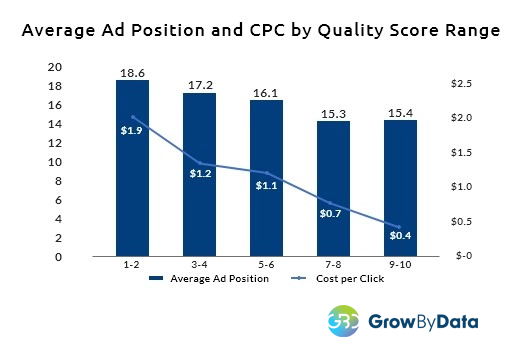
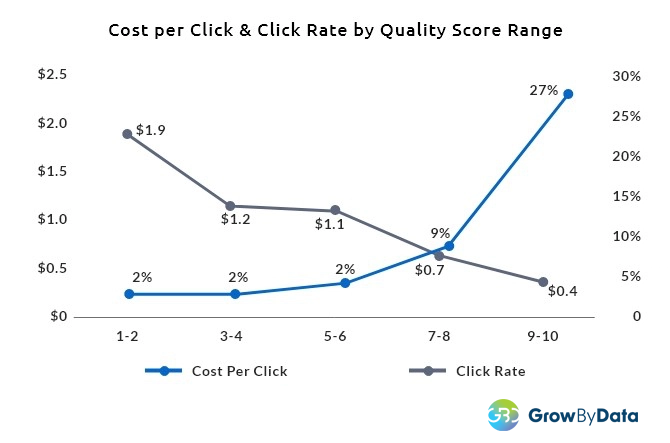
Similarly, we looked at the effect of Quality Score on Ad Rank. Our data showed ads that have a higher position in the ad auction typically have a higher Quality Score, as depicted by Graph #2 below. The graph also shows that the CPC is decreasing, as the Quality Score is increasing and improving the ad’s ranking.
3. Quality Score Improves Click-Through Rates (CTR)
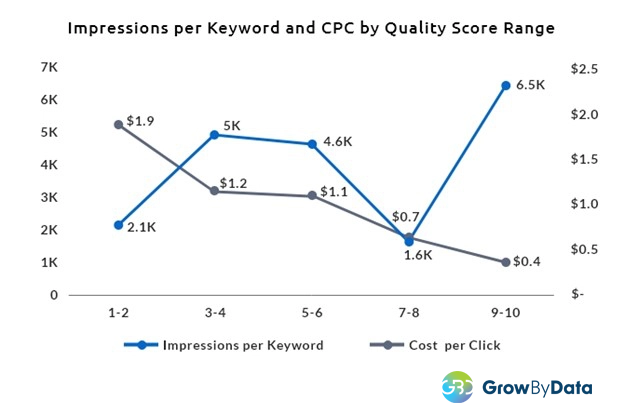
Next, we looked at what percentage of ads were being clicked on, in addition to the CPC. Graph #3 below highlights the importance of having a higher Quality Score. It shows that the chances of your ad being clicked is significantly higher with a Quality Score of 9 to 10 (27%), versus a score of 1 to 2 (2%).
Graph #3 also highlights the fact that, even though the total cost is higher keywords with Quality Score of 9 to 10, the CPC is significantly lower than those with lower Quality Scores. The CPC is highest for scores in the 1 to 2 range, costing almost $2 per click. Scores above 7 cost less than a dollar per click, on average.
4. Quality Score Creates Better Sales Conversion
Just clicking on an ad is not enough. The final goal is conversion to sales and generating revenue. Therefore, we looked at the data on the effect of Quality Scores on conversions and cost per conversion. Per Graph #4 below, we found that cost per conversion is much lower if you have a higher Quality Score. The average cost per conversion on keywords with a score of 9 to 10 is $10, whereas keywords with scores of 1 to 2 is $35. Ads with a score between 9 and 10 also had conversion rates of almost 7%, which is exponentially higher than the rest.
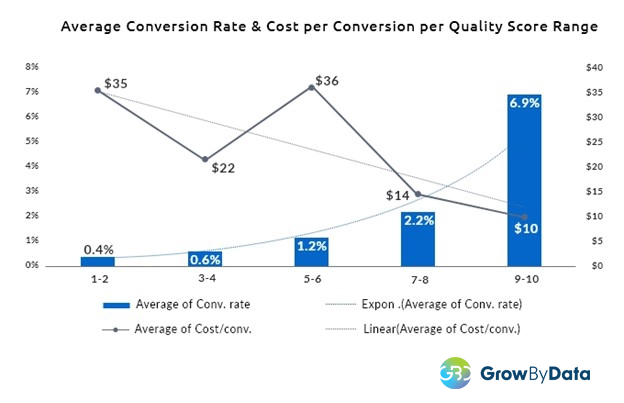
The data analysis and graphs above show why it is important to have a high Quality Score and how it can impact impressions, clicks, conversions, Ad Ranks and helps to maximize ROAS.
In Conclusion: How can you Best Improve Your Quality Score?
As stated above, we now know the three main factors that heavily affect Quality Scores: click-through rate (CTR), ad relevance, and landing page experience. As such, the following are some optimizations an advertiser can do to improve their Quality Scores:
- Improve your CTR:
- One of the best ways to improve CTR is by using Google Shopping ad extensions. They help differentiate your ad and stand out in the ad auction.
- Knowing your exact target market can help you target specific areas/regions or audiences that may be more likely to click on your ads. Organizing your keywords into smaller groups makes it easier to attach it to a specific ad campaign.
- Use repricing tools for dynamic pricing to make sure your prices are comparable to, if not cheaper than, your competition.
- Boost your ad relevance:
- Optimize your product feed with the correct information such as GTIN, image, title, attributes of the product, description, product category, etc. to increase your ad relevancy.
- Enrich your product images with the right Google specifications.
- Understand the intent of your customers to write better and more relevant product titles and descriptions.
- Analyze the top-ranked ad content, understand the factors affecting Google ad impression and position, then optimize your ad’s content.
- Design a positive landing page experience:
- The information provided on the landing page should be the same as what is being offered on the ad itself.
- The landing page load speed is fast and it’s easy to navigate.
- The landing page is optimized on all devices, such as mobile, tablet, and desktop.
- Make sure the landing page data is enriched (i.e. remove inaccurate, outdated, and irrelevant information, and constantly update obsolete records with correct and up-to-date information).
Final Thoughts on Quality Scores
Features that influence Quality Score play a crucial part in how Google decides where the ad is ranked, and which ads show up in the ad auction. Next to the ad bid, Quality Score is the most influential metric in Google Adwords. Sometimes, a higher Quality Score can be even more influential than a higher bid amount in the ad rankings. Therefore, it is vital to keep track of your Quality Scores and try to improve the lower ones.
Ad Intelligence tool gives unprecedented insights into competitors and their ad contents, such as product titles, product images, product attributes, landing URLs, prices, ad extensions, shipping labels, etc. These factors influence Google Quality Scores and affect ad rankings. Having this level of granular data and information can enhance the quality of your ads, improve your Quality Scores, and lower your ad spend.
GrowByData Article Originally Published at Retail Touch Points on February 22, 2021.

