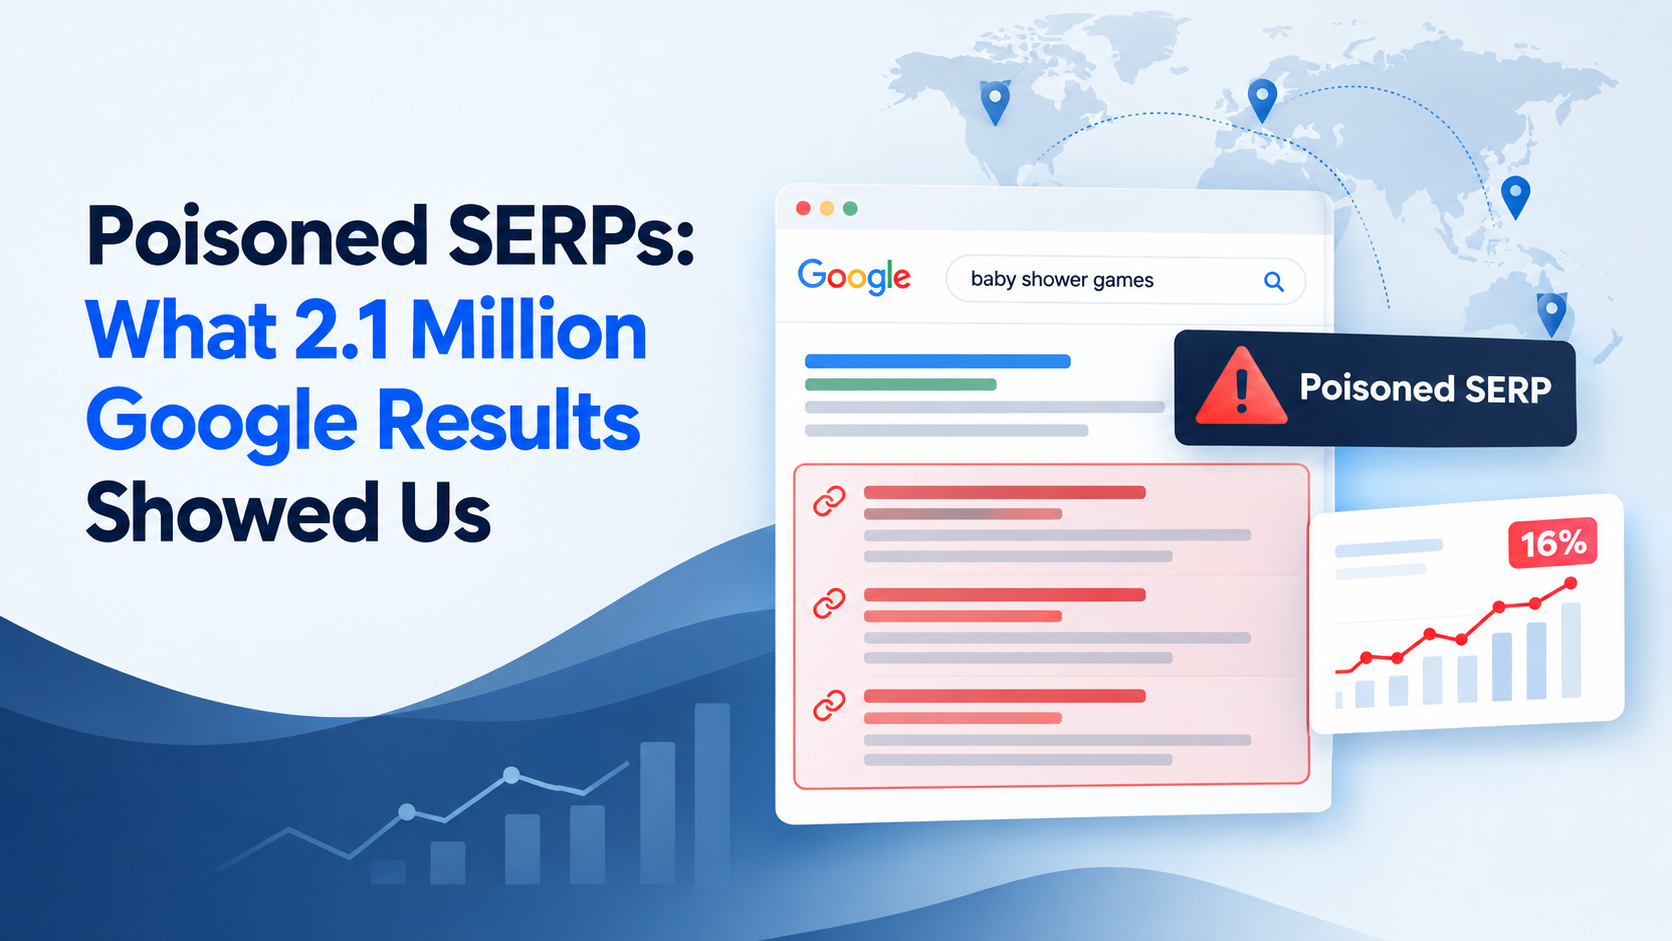
Since late September 2026, some automated Google searches have returned normal-looking results pages where many of the sites that usually rank are missing. Independent rank trackers and SERP API providers have reported similar patterns. For SEO and paid search teams, the risk is clear: a distorted results page can look like a real ranking loss.
We examined our own SERP collections to understand how often this pattern appeared, how it differed across markets, and what it means for interpreting search visibility data.
Data analyzed: Approximately 2.1 million Google SERPs collected from June 1 to October 27, 2026, covering desktop and mobile searches in six US cities, the United Kingdom, Ireland, Canada, and Australia.
The Numbers: From a 1% Baseline to a 16% Peak
| What We Measured | Result |
|---|---|
| SERPs analyzed | Approximately 2.1 million |
| June to August baseline | About 1% of pages flagged by our comparison rule |
| Highest observed weekly rate | 16.0% in Ireland, week of September 28 |
| United States, October 16 to 18 | 3.4% flagged |
| Canada, October 16 to 18 | 1.5% to 1.9% flagged |
These percentages measure pages flagged as abnormal against a keyword-specific historical reference. They are not a count of cases independently confirmed to have been deliberately altered by Google.
The Trend: All Five Markets Rose in Late September
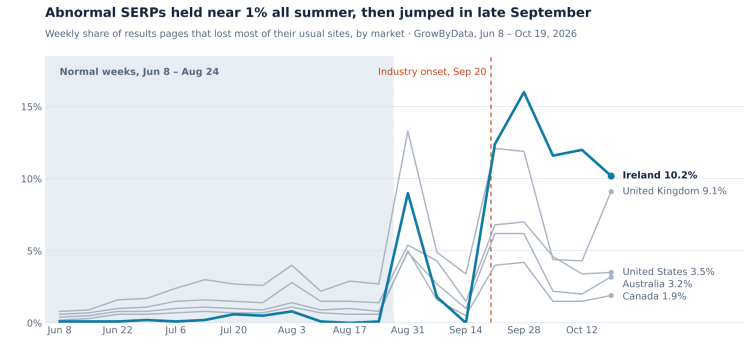
- June through August provided a relatively stable baseline. About 1% of pages in each monitored market met our abnormal-results threshold during this period.
- Rates rose across all five markets in late September. The increase began around the week of September 21. The broad timing across markets and keyword sets is difficult to explain as ordinary, site-specific ranking movement alone.
- The United States, Canada, and Australia have declined from their peaks. Their latest weekly readings range from 1.9% to 3.5%. They remain above the roughly 1% summer baseline, so it is premature to call the issue fully resolved.
- The United Kingdom and Ireland remain the most affected in our latest readings. Ireland recorded 10.2%, and the United Kingdom recorded 9.1%.
| Market | Latest Weekly Reading | Peak Since September 21 | Interpretation |
|---|---|---|---|
| Ireland | 10.2% | 16.0% | Still elevated |
| United Kingdom | 9.1% | 12.1% | Still elevated |
| United States | 3.5% | 7.0% | Below peak, above baseline |
| Australia | 3.2% | 6.2% | Below peak, above baseline |
| Canada | 1.9% | 4.2% | Below peak, above baseline |
Latest weekly readings are from the reporting period ending by October 27, 2026. Market rates reflect the monitored keywords, devices, and locations in this study, not all Google searches.
The Example: Five Usual Sites Disappeared for “Baby Shower Games”
Consider the query “baby shower games” on desktop in London. On October 20, the results looked relevant at a glance. But compared with October 12 to 18, the set of ranking domains had changed substantially.
| Usual Domains, October 12 to 18 | Domains Observed, October 20 |
|---|---|
| pampers.co.uk | foreverlily.co.uk |
| bumblesandboo.com | evite.com |
| thebump.com | facebook.com |
| amazon.co.uk | partyrama.co.uk |
| happity.co.uk | pampers.com |
| eventifai.com | |
| pinterest.com | |
| babycenter.com |
The five domains on the left each appeared in at least 60% of the reference week’s searches. None appeared in the captured October 20 results, which instead contained the eight domains on the right. The two columns show separate sets of sites, not one-to-one ranking replacements.
One noteworthy change was the appearance of pampers.com in place of the previously common pampers.co.uk domain for a London-targeted query. That change alone does not prove the page was poisoned. Combined with the simultaneous disappearance of all five usual domains, it is a reason to investigate before treating the results as a genuine ranking shift.
The Comparison: Other SERP Providers Reported Very Different Rates
GrowByData is not the only company documenting this problem. Nozzle published research on poisoned Google SERPs on October 10, 2026. cloro published a comparison of four SERP APIs using the same reference queries from October 16 to 18.
In cloro’s comparison, the share of degraded pages was 0.8% for cloro, 3.2% for Oxylabs, 31.9% for SerpApi, and 61.8% for DataForSEO. Failed API calls were counted separately from degraded pages, which matters when interpreting each provider’s overall reliability.
Over those same three days, GrowByData flagged 3.4% of its US results pages, with Canada’s reported figures ranging from 1.5% to 1.9%. But these are not like-for-like measurements. cloro checked a fixed set of reference queries against known results. Our analysis compared each tracked keyword with the domains that had ranked consistently in its recent history. The samples, scoring rules, and treatment of failed requests differ.
The comparison supports one practical conclusion: a provider’s reported abnormal-results rate depends on its collection methods and how it checks results quality. A smaller percentage does not, by itself, establish better performance across providers.
The Method: Compare Results With Each Keyword’s History
A simple day-over-day comparison is not enough. Yesterday’s page may also be abnormal, and a normal Google ranking change may persist for more than one day. Our analysis uses a reference based on the history of the same keyword, device, and location, consistent with the broader historical-comparison approach described in Nozzle’s research.
- Identify the usual domains. For each keyword, device, and location, identify domains that appeared in the top 10 in at least 60% of the previous week’s collected results.
- Compare the new collection. Flag the page as abnormal when fewer than half of those usual domains appear anywhere in the captured results.
- Interpret the flag in context. Check whether the established domains return, whether unrelated keywords changed at the same time, and whether Google Search Console shows corresponding movement. A flag is a diagnostic signal, not definitive proof of poisoning.
During June through August, roughly 1% of eligible results pages triggered this rule. That historical rate gives us a useful baseline for measuring unusual increases. It does not imply that every baseline flag was a genuine ranking change or that every later flag was caused by Google serving a degraded page.
How to Tell a Poisoned Page From a Real Ranking Drop
When a tracked site suddenly disappears from the top 10, look at more than its reported position:
- The results page still looks normal. A degraded page can include organic results and familiar SERP features without an error or CAPTCHA. Visual completeness is not proof that the rankings are reliable.
- Several established domains disappear together. A sharp change in the entire result set deserves investigation, although broad algorithm updates can also affect many sites.
- The geographic mix changes unexpectedly. A locally targeted query may suddenly return more domains from outside its usual market. This is a clue, not proof on its own.
- The earlier result set returns. If familiar rankings reappear in subsequent collections, that supports the case for a temporary collection anomaly. Genuine rankings can also fluctuate, so check the wider pattern.
- Search Console tells a different story. Stable impressions and clicks alongside a sudden rank-tracking collapse may warrant further checks. Search Console is not a perfect real-time validation source, and its metrics are not directly equivalent to a rank tracker.
- Unrelated keywords change at the same time. Similar anomalies across multiple topics or markets may point to a data-collection issue rather than a change affecting one website.
What This Means for Search Visibility Reporting
A sudden ranking decline should not immediately trigger an SEO response when the entire captured results page looks unusual. Start by checking the keyword’s historical ranking domains, the device and location targeted, subsequent collections, and relevant Search Console trends.
For teams relying on SERP data, the questions to ask a provider are straightforward: How are abnormal pages detected? How are flagged collections represented in reporting? Are any replacements or repeat collections subject to quality checks? These details matter when interpreting rankings and share of voice.
In our monitored dataset, the UK and Ireland showed the most persistent elevated rates through October 27. We are continuing to review those market-level patterns as the evidence develops.
Want to understand whether abnormal SERP collections are affecting your reporting in your chosen markets and devices? Talk to a GrowByData expert about an audit of your tracking data.
Research note: These findings reflect GrowByData’s analysis of approximately 2.1 million collected SERPs through October 27, 2026. The reported rates describe pages flagged using a historical comparison rule, not independently confirmed instances of intentional changes by Google. Google has not publicly explained the underlying cause in the cited studies, and the results may change as new data is collected.