
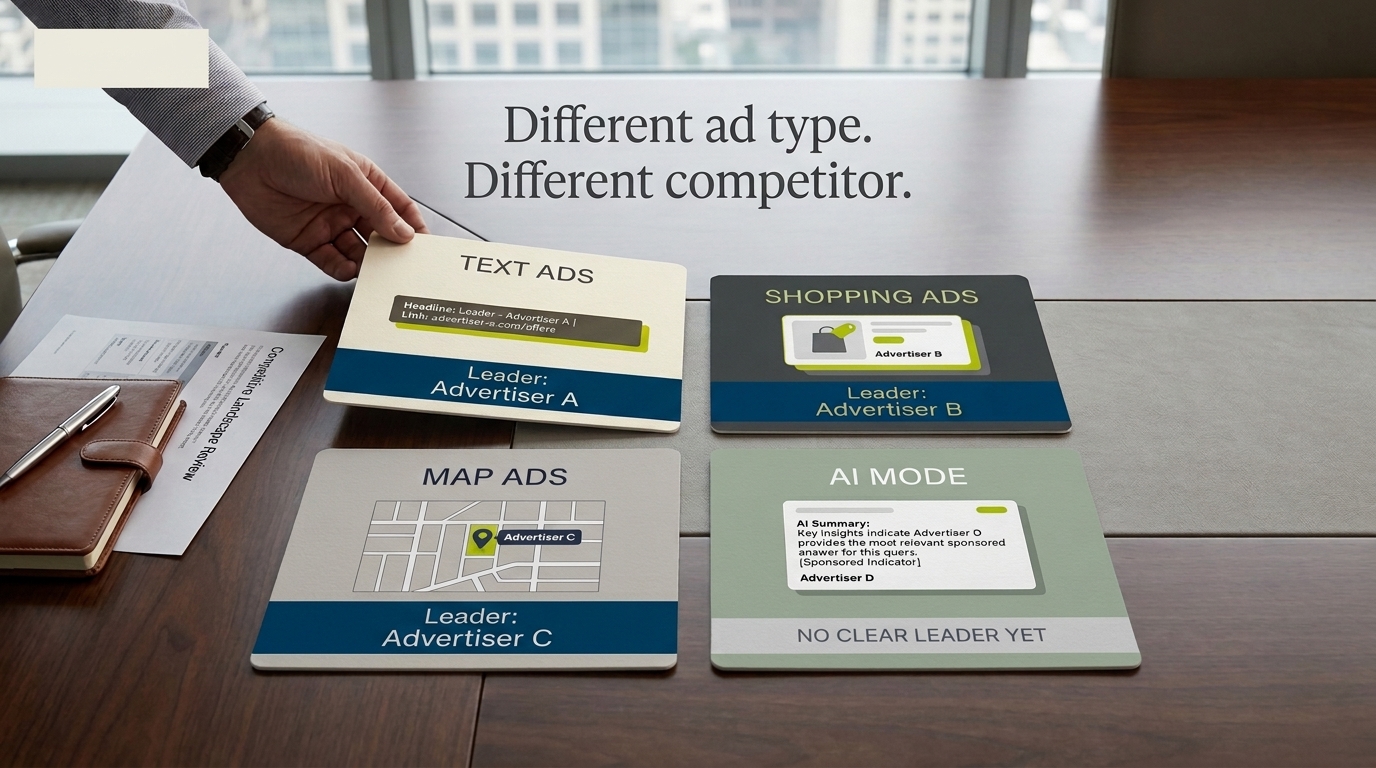
A Google Ads competitor analysis shows which brands advertise against you on Google, and how often their ads show up on the searches that matter to you. It covers four ad types: Google Text Ads, Google Shopping Ads, Google Map Ads and Google AI Mode ads. Check each one on its own, because a different brand can lead each one.
Our view: most teams run it as a Text Ads exercise and name the wrong rival. In our home furnishings data, the brand with the most Text Ads had almost no Shopping Ads and no Map Ads at all.
A quick note on names. Google calls these text ads, Shopping ads, Local Ads and ads in AI Mode. Local Ads can also show in Google Maps and, in the US, Waze; by Map Ads we mean the Local Ads in the map results on Google Search, which is what we measured.
The Data: Three Ad Types, Three Different Leaders. Home furnishings, Google US, September 7 to October 4, 2026: Amazon led Text Ads with 5.4%, Wayfair led Shopping Ads with 11.9% and Sleep Number led Map Ads with 14.9%. A Text Ads-only analysis would miss two of the three leaders.
How To Do A Google Ads Competitor Analysis
To do a Google Ads competitor analysis, pick the keywords that matter to you, check Google’s own tools, then measure Text, Shopping, Map and AI Mode ads one at a time over the same dates. Compare each rival’s share in every ad type, by device and city, before you shift budget.
Each ad type needs its own check. Most guides stop at reading a rival’s ads and guessing its spend with a third-party tool. That tells you what a rival says, but not how often it shows up, and how often is what settles budget arguments.
| Ad type | What to compare | What Google gives you | What Google won’t show you |
|---|---|---|---|
| Google Text Ads | Who shows up, how often, how high on the page, and what the ads say | Auction insights for Search campaigns, Ads Transparency Center | Searches where you didn’t bid |
| Google Shopping Ads | Who shows up, how often, at what price, with which sale tags and star ratings | Auction insights for Shopping campaigns, Ads Transparency Center | Searches where you didn’t bid, and how your prices compare with rivals’ |
| Google Map Ads | Who shows up in the map results on Google Search, and in which cities | Ads Transparency Center, which includes Maps ads | A separate auction insights report, because Map Ads aren’t their own campaign type |
| Google AI Mode ads | Which brands’ ads appear inside AI Mode answers, and on which questions | Google’s public AI Mode information doesn’t describe placement or competitor reporting | Rivals’ AI Mode ads, unless you check the answers yourself |
The steps:
- List your keywords and questions. Split brand terms from generic ones, group them by product, and add the questions shoppers type into AI Mode.
- Pull auction insights for each campaign type. Search and Shopping report different numbers, so don’t average them.
- Look up rival ads in the Ads Transparency Center. Note the offers and claims they keep repeating.
- Measure Text Ads. How often each rival shows up, how high on the page, and how often it’s visible without scrolling.
- Measure Shopping Ads. How often each rival shows up, plus its prices, sale tags and star ratings.
- Measure Map Ads city by city. Start with the cities where you or your rivals have stores; local and international SERP monitoring tracks them city by city.
- Check AI Mode ads on your questions. Note which brands’ ads appear over weeks, not days, by hand or with Google AI Mode monitoring.
- Put the ad types side by side and act. Same keywords, same dates. Fix one gap at a time.
How To Check Competitor Google Ads?
To check a competitor’s Google Ads, search their brand name or website in Google’s Ads Transparency Center. It shows the Search, Shopping and Maps ads a verified advertiser has run, but not where those ads show up on your keywords today, so pair it with your own searches and AI Mode checks.
The Ads Transparency Center has limits worth knowing before you rely on it. According to Google’s Ads Transparency Center FAQ, it shows up to 5 versions of each ad, and new ads can take 48 to 72 hours to appear.
One common tip is now out of date. Many guides, and some AI answers, say you can click through to a rival’s landing pages from the Transparency Center. Google’s FAQ says ads there can’t be clicked anymore and calls this “a permanent change,” so visit those pages from live searches instead.
How To Track Competitors In Google Ads?
To track competitors in Google Ads, use auction insights for your Search and Shopping campaigns, then track the live search results and AI Mode answers yourself. Auction insights only compares you with brands bidding in the same auctions you entered, so rivals on keywords you skip, or in cities you don’t target, never show up.
Search and Shopping campaigns get different auction insights numbers. Google Ads Help lists them:
| Campaign type | Auction insights metrics | In plain terms |
|---|---|---|
| Search | Impression share, overlap rate, position above rate, top of page rate, absolute top of page rate, outranking share | How often you and each rival appear, appear together and outrank each other, and how often each lands at the top |
| Shopping | Impression share, overlap rate, outranking share | The same idea with 3 numbers instead of 6, for ads on the Search Network only |
Performance Max campaigns get auction insights too, for their Search and Shopping ads on the Search Network. Google also sets limits: you get no insights if your impression share is under 10% or if there’s too little activity, and ads on Search partner sites aren’t counted.
Map Ads and AI Mode ads have no campaign type of their own. Google’s Local Ads help page says Local Ads run through Search and Performance Max campaigns.
Google’s AI Mode ads announcement says AI Mode ads run on AI Max and Performance Max, with no mention of placement or competitor reporting. For ads in AI Overviews, a separate placement, Google Ads Help says they aren’t broken out in reports at all.
That’s why auction insights works best as a weekly check on the rivals you already know. Tracking the live results answers a different question: who leads your keywords in every ad type, whether you bid or not. You need both, and you shouldn’t blend them into one number.
Amazon Led Home Furnishings Text Ads At 5.4% And Showed No Map Ads
Step 8 is where the wrong-rival problem shows up, so we tested it on one category: home furnishings in the GrowByData Retail Industry Panel, from September 7 to October 4, 2026. We measured each brand’s share of Text, Shopping and Map Ads on the same keywords, and checked AI Mode answers too.
A Text-only analysis would tell a furniture or mattress brand its biggest Google Ads rival is Amazon. Amazon had 5.4% of all Text Ads, more than anyone else. That only holds until you look at the other ad types.
| Advertiser | Share of Google Text Ads | Share of Google Shopping Ads | Share of Google Map Ads | Google AI Mode ads |
|---|---|---|---|---|
| Amazon | 5.4% | Under 0.1% | None seen | Not seen |
| Wayfair | 2.4% | 11.9% | 0.2% | Not seen |
| Sleep Number | 3.5% | 0.6% | 14.9% | Appeared |
| Living Spaces | 3.7% | 2.4% | 4.3% | Appeared |
| Mattress Firm | 1.4% | 0.8% | 8.5% | Appeared |
| Saatva | 0.1% | 3.9% | 0.2% | Appeared |
Each share is the brand’s slice of all the ads we saw in that ad type on these keywords, not its share of the whole results page. Selected brands shown. Source: GrowByData Retail Industry Panel, Google US, all tracked devices, September 7 to October 4, 2026.
Wayfair led Shopping Ads with 11.9%, about five times its share of Text Ads. Sleep Number led Map Ads with 14.9%, yet had under 1% of Shopping Ads. Amazon barely showed up outside Text Ads.
None of these ad types is a sideshow. Text Ads appeared on 37% of the results pages we checked, Shopping Ads on 15% and Map Ads on about 10%. A rival that leads Map Ads is reaching local shoppers on a real share of your searches, even if it never appears in your Text Ads report.
There were too few AI Mode ads in these four weeks to work out a fair share. Sleep Number, Saatva, Mattress Firm and Living Spaces all showed ads inside AI Mode answers, while Amazon and Wayfair didn’t. Over 90 days Wayfair did appear, which is the point: AI Mode needs a longer look than regular search results.
Amazon’s near absence from Shopping isn’t a glitch: Search Engine Journal reported that Amazon’s US Shopping impression share fell to zero around July 23, 2025, and was still 0% in Tinuiti’s Q2 2026 benchmark. The brand that dominates one ad type can be missing from the next.
How we measured this: GrowByData Compass checked Google US search results (national plus 12 cities) on all tracked devices for the home furnishings keywords in the GrowByData Retail Industry Panel. Text share counts Text Ads; Shopping share counts paid Shopping Ads only, not the unpaid product listings Google calls Merchant Listings; Map share counts Map Ads where we could identify the advertiser. AI Mode ads come from a separate list of home and furniture questions asked in Google AI Mode over the same dates, not the same keywords. Limits: one category, four weeks, and only ads we saw. These numbers don’t show spend, clicks or impressions. For how share is worked out, see our guide to Google Share of Voice.
See who leads your keywords in each ad type. We can show you your rivals’ share of Text, Shopping and Map Ads side by side, plus who advertises in AI Mode on your questions, in your chosen markets and devices. Book a demo or a Google Ads competitor audit.
How Can I Analyze Competitor Ads?
To analyze competitor ads, look at what each rival says and how often it shows up, one ad type at a time. Read the headlines and offers in Text Ads, check prices and sale tags in Shopping Ads, and see which cities rivals cover in Map Ads. In AI Mode, note which questions bring up a rival’s ad.
Where a brand advertises often says more about its plan than what its ads say. Sleep Number put a sale tag on 47% of its Shopping listings and still had only 0.6% of Shopping Ads. Its strongest visibility was in Map Ads, where it led, a pattern consistent with a heavier focus on local store discovery.
Wayfair did the opposite. It led Shopping with a sale tag on about 17% of its listings, and barely appeared in Map Ads. Living Spaces got 2.4% of Shopping Ads with almost no sale tags, so discounts aren’t the only way in.
For Text Ads, watch for messages that keep coming back week after week. A rival that changes its offer every few days is still testing. One that keeps the same offer for a month has outlasted a short test, so treat it as the claim your ads have to answer.
What Is A Good Competitor Analysis Tool For Google Ads?
A good competitor analysis tool for Google Ads depends on the question you’re asking. Google’s own tools show your auctions and your rivals’ ads, third-party tools estimate rivals’ keywords and spend, and tracking tools check the live results and AI Mode answers for your keywords. Most enterprise teams need all three.
| Tool type | Best for | What it can’t tell you |
|---|---|---|
| Google Ads auction insights | Rivals in the Search, Shopping and Performance Max auctions you entered | Anyone outside those auctions; anything when your impression share is under 10%; Map Ads or AI Mode ads on their own |
| Ads Transparency Center | What a rival’s Search, Shopping and Maps ads say, by region | Where and how often those ads show up on your keywords |
| Third-party keyword and spend tools | Rivals’ keyword lists and estimated spend | Real budgets or results; treat them as estimates |
| Search and AI tracking tools | Each rival’s share of Text, Shopping and Map Ads on your keywords, and who advertises in AI Mode on your questions | Spend, and any keywords or questions you don’t track |
The catch with tracking tools is coverage. They only report on the keywords and questions you give them, so a weak list gets you a confident answer to the wrong question.
How GrowByData Helps
GrowByData is a search and AI visibility intelligence company for enterprise brands, retailers and agencies. GrowByData Compass tracks Text Ads, Shopping Ads, Map Ads and organic results on Google for the keywords you pick, and AI Mode answers for the questions you pick, in your chosen markets and devices.
It powers GrowByData’s competitive ad intelligence and Google Shopping Ads monitoring, so you can compare each rival across all four ad types in one view.
Most teams find the wrong-rival problem in a budget review, after the money is spent. Book a demo or a Google Ads competitor audit, and we’ll show you who leads your keywords in each ad type.
FAQ
Can you see a competitor’s Google Ads budget?
No tool can see a rival’s real budget. Spend numbers from third-party tools are estimates. Tracking shows how often a rival appears and where, which often hints at budget changes, though it can also reflect better ads or new keywords.
How often should you run a Google Ads competitor analysis?
Our view: weekly in Q4 and around your own sales, monthly the rest of the year. Rivals change offers fastest around sale events, and a monthly check can miss a two-week push. Give AI Mode ads a longer window than the rest.
Do you need to bid on a keyword to see who advertises on it?
Not if you track the live results, which show who advertises whether you bid or not. Auction insights is different: it only covers auctions your account entered.
Should you report all ad types as one share number?
No. One blended number hides which ad type a rival is winning, and where your own gaps are. Report each ad type side by side, on the same keywords and dates.