Amazon Prime Day 2024 has once again proven to be a pivotal event in the retail calendar, reshaping market dynamics across multiple categories. Let’s dive into the data to uncover the trends and insights from this year’s shopping extravaganza.

Apparel & Accessories: A Rollercoaster Ride
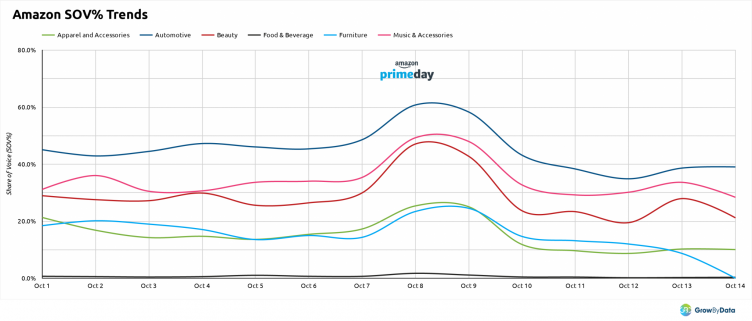
Amazon’s share of voice (SOV) in Apparel & Accessories dramatically surged during Prime Day. Starting at 21.3% on October 1, it peaked at 25.4% on October 8, showcasing a 46.9% growth rate. This spike demonstrates Amazon’s ability to capitalize on seasonal events with aggressive promotional activities. However, the drop in post-Prime Day to 10% by October 14 highlights the event’s temporary nature.
Automotive: Consistent Dominance
The Automotive sector witnessed Amazon’s unwavering strength. With an initial SOV of 45.1% on October 1, Amazon reached a commanding 61% on the main Prime Day. This 25.07% growth rate underscores Amazon’s powerful presence in automotive goods during key shopping periods.
Beauty: Prime Day Boost
Beauty products saw a significant Prime Day impact. Amazon’s SOV jumped from 29% on October 1 to 47% on October 8, marking a 57.21% growth rate. This surge reflects the effectiveness of Amazon’s promotional strategies in the beauty sector.
Furniture: Steady Growth
While less dramatic than other categories, Furniture still experienced notable growth. Amazon’s SOV increased from 18% to 24.5% on Prime Day 9th of October, with a 63.2% growth rate, indicating strong consumer interest in home furnishings during the event.
Food & Beverage: Modest but Meaningful Gains
Despite lower overall SOV, the Food & Beverage category saw impressive relative growth. Amazon’s SOV rose from 0.7% to 1.7% on Prime Day, representing a substantial 157.991% increase. This suggests growing consumer interest in purchasing groceries and beverages through Amazon during promotional events.
Music: Hitting the Right Notes
The Music sector showed remarkable growth, with Amazon’s SOV rising from 31.1% to 49.3% on Prime Day. This 39.37% growth rate highlights the category’s strong performance during the event.
Read More On Amazon Prime Day
- Amazon Prime Day Decoded in July: What the Data Reveals in 2024
- Amazon Spent Heavily on Google Shopping Ads During Prime Day
- Amazon’s SOV Trends Comparison (2023 vs 2022): Insights from the Music and Apparel Industries
Competitive Landscape
Prime Day significantly altered the competitive dynamics across categories. In most sectors, Amazon solidified its leading position during the event:
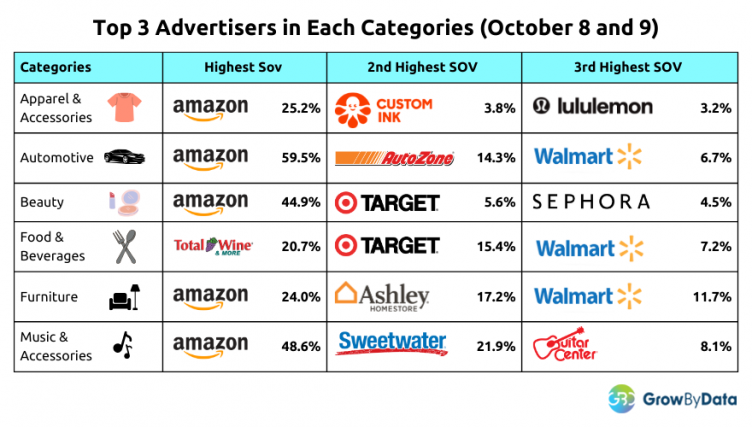
- Apparel & Accessories: Amazon’s SOV increased from 16.2% to 25.2% during Prime Day.
- Automotive: Amazon’s dominance grew from 45.7% to 59.5%.
- Beauty: Amazon’s lead expanded from 27.9% to 44.9%.
- Furniture: Amazon’s SOV jumped from 16.8% to 24.0%.
- Music & Accessories: Amazon’s share increased from 33.0% to 48.6%.

Interestingly, in the Food & Beverages category, Total Wine maintained its lead throughout the period, suggesting that some niches remain resilient to Amazon’s Prime Day influence.
Key Takeaways
- Prime Day continues to be a major driver of sales and market share for Amazon across diverse retail categories.
- The event’s impact varies by category, with some seeing dramatic spikes and others experiencing more modest growth.
- While Amazon dominates during Prime Day, the effect is often temporary, with market shares normalizing post-event.
- Competitors in niche markets can maintain their positions even during Prime Day, as seen in the Food & Beverages category.
For retailers and brands, these insights underscore the importance of strategic planning around major shopping events like Prime Day. Whether competing directly with Amazon or leveraging the increased consumer activity during this period, understanding these trends is crucial for success in the ever-evolving e-commerce landscape.
Looking to stay ahead of the competition during key shopping events like Prime Day? GrowByData’s ecommerce data solutions can help you navigate the ever-changing landscape and maximize your market share.


