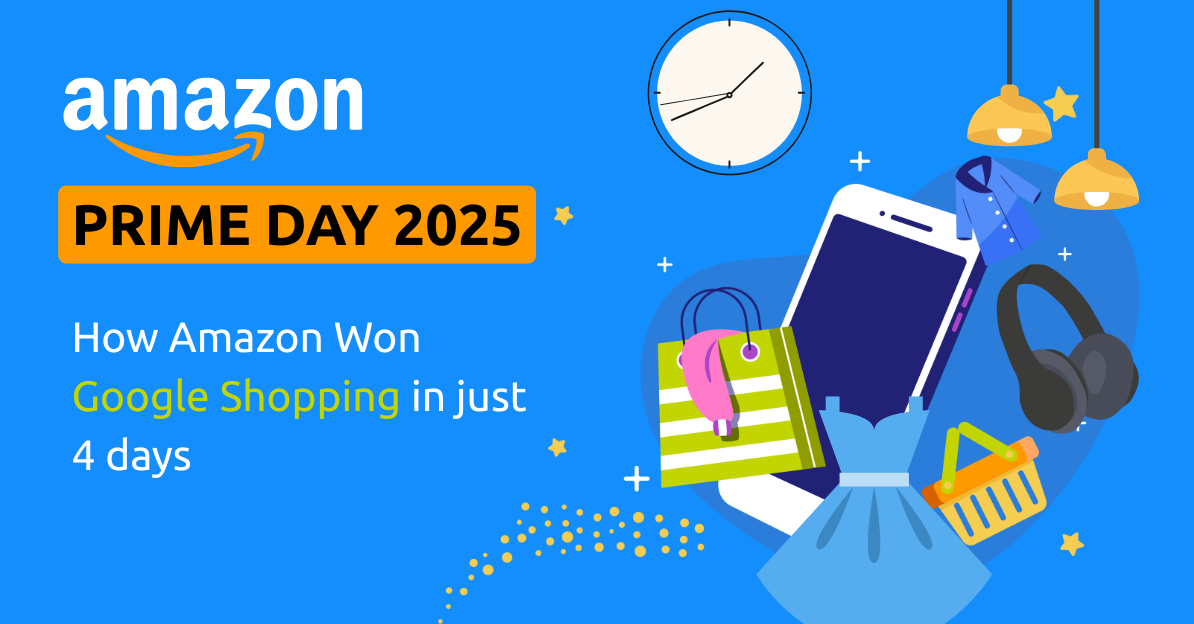
Amazon Prime Day was bigger, longer, and more competitive than ever in 2025. From July 8 to 11, brands and retailers across the U.S competed not only for conversions but for visibility and that battle played out on the Google Shopping results page.
To analyze Amazon performance on this day, GrowByData tracked 3,661 keywords across five different industries. But unlike traditional tools, our analysis went deeper with our Google Shopping Monitoring Solution. We didn’t just track ad presence but tracked where listings appeared: in Visible Carousels and Expanded Carousels.
The result? A uniquely detailed look at how Amazon outpaced rivals and how quickly the landscape shifted after the sale.
How We Tracked It
GrowByData monitored Google Shopping Share of Voice (SOV) for these industries:
- Apparel & Accessories
- Automotive
- Furniture
- Music
- Retail
Amazon’s Share of Voice: A Sharp Surge in Prime Day
One of the most immediate signals of Amazon’s Prime Day strategy was its surge in Share of Voice (SOV). In the days leading up to the Prime day, Amazon ramped up its Shopping Ads presence across nearly every major category we tracked. Amazon had plenty of stored ad budget to use after their pullback from Google Shopping in mid-May.
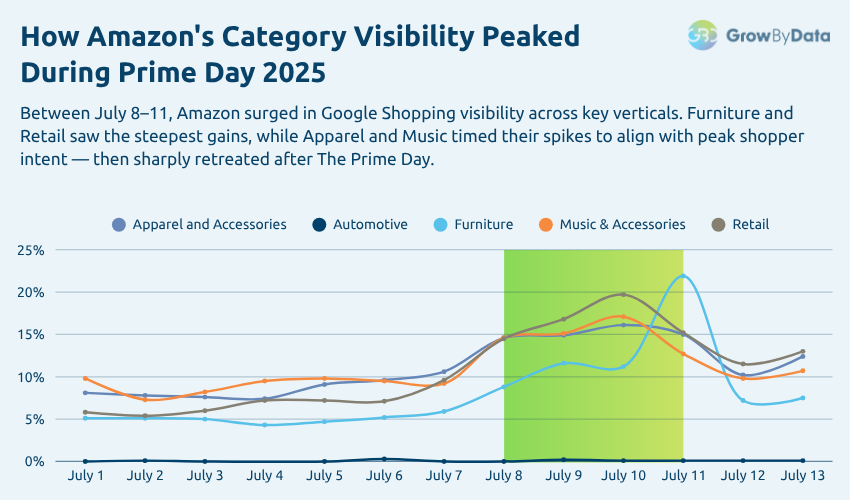
Looking at the Google Shopping Ads daily trends, Amazon strategically surged in the visibility across all 5 industries. Amazon SOV tripled in both Automotive and Furniture industries. When compared, all industry saw a double figure growth rate which shows the planned Google Shopping Advertising strategy of Amazon.
However by July 12, Amazon again pull back their advertising across the industries. We are seeing a sharp decline in Amazon’s SOV% from 5% to 70%.
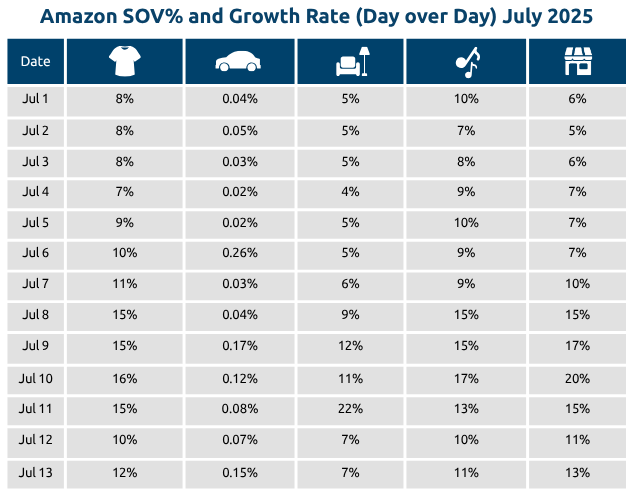
| Industry | SOV on July 1 | Peak SOV (Prime Day) | % Growth | Post Prime Day | % Decline |
|---|---|---|---|---|---|
| Apparel | 8.1% | 16.1% (July 10) | +100.3% | 12.4% | -32.4% |
| Automotive | 0.04% | 0.17% (July 9) | +332.1% | 0.15% | -5.1% |
| Furniture | 5.1% | 21.9% (July 11) | +325.6% | 7.4% | -67.1% |
| Music & Accessories | 9.8% | 17.1% (July 10) | +73.3% | 10.7% | -42.2% |
| Retail | 5.8% | 19.7% (July 10) | +237.5% | 13% | -41.6% |
Amazon vs. Competitors: Who Held Their Ground?
While Amazon took the spotlight during Prime Day, it wasn’t the only advertiser competing for premium SERP real estate. This section compares how Amazon stacked up against other top retailers, when some of which typically dominate in their core categories.
| Rank | Advertiser | Strongest Category | Peak SOV | Amazon’s SOV |
|---|---|---|---|---|
| 1 | Amazon | Furniture | 21.9% | – |
| 2 | Walmart | Retail | 13.6% | 19.7% |
| 3 | Wayfair | Furniture | 11.8% | 21.9% |
| 4 | Target | Apparel | 10.2% | 16.1% |
| 5 | Best Buy | Music | 9.4% | 17.0% |
Carousel Placement: What Most Tools Missed
Most brands focus on volume. But Amazon’s real edge was placement. From July 8–11, they led in:
- Visible Carousels owning top-of-SERP real estate in Retail, Apparel, and Music.
- Expanded Carousels peaking early to catch high-intent shoppers.
Together, this dual strategy helped them win both reach and conversion. Together, this two-tiered approach ensured Amazon captured both casual browsers and committed buyers.
Amazon Prime Day Trends
Looking beyond daily spikes or leaderboard rankings, we analyzed even the smallest changes in Amazon’s visibility. From overall gains across industries to a notable post-event decline, these SOV % trends reveal the broader strategy and impact of Prime Day 2025 on Google Shopping.
1. Momentum Building
From July 1 to 7, Amazon gradually saw increased visibility, especially in Furniture and Apparel as you can see in the image above.
2. Prime Day Surge
SOV across most categories peaked July 10 to 11. Listings spiked in both carousel types.
3. The Post-Prime Day Slump
Once Prime Day ended, Amazon’s SOV fell an average 57% across all industries, with the steepest declines in:
- Apparel & Accessories: -32.4%
- Automotive: -5.1%
- Furniture: -67.1%
- Music & Accessories: -42.2%
- Retail: -41.6%
Strategic Takeaways
What can retailers and brands learn from Amazon’s approach? These takeaways summarize the key lessons from our Prime Day analysis:
- Timing Wins Prime Day: Amazon surged precisely from July 8 to 11.
- Category Depth Beats Breadth: They focused where they could win especially in Furniture and Music.
- Expanded vs. Visible Matters: Placement ties directly to user intent and conversion.
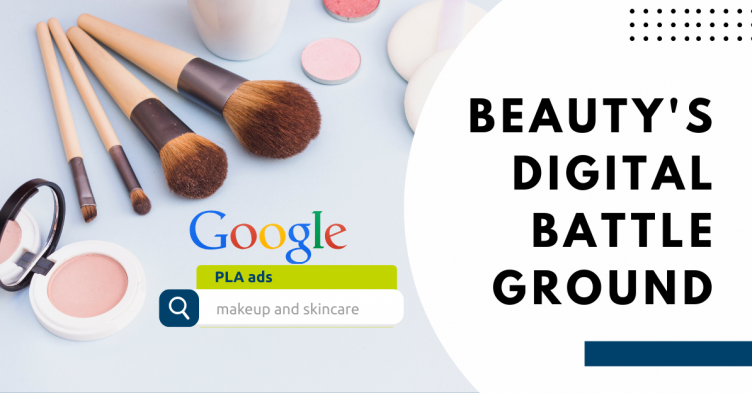
In categories like Beauty, the competition remains fierce. Explore the Beauty Battleground →
Final Thoughts: SERP Real Estate Is the New Shelf Space
Amazon’s Prime Day performance on Google Shopping reinforces a critical truth: the SERP is today’s shelf space. If you don’t know where you show up or how, you’re already behind your competitors. So it best to track and monitor your SERP to gain any edge against your competitors.
What this year’s Prime Day showed is simple: Winning isn’t just about showing up in search. It’s about where you show up, and when.
Retailers with visibility into carousel-type, category SOV, and daily shifts have a real edge.
GrowByData turns search visibility into strategic advantage.