Black Friday sales are a yearly tradition and ritual in the retail world. Consumers await this day to do most of if not all of their holiday shopping, with expectations of unbeatable deals, discounts, and special offers. It’s one of the biggest shopping days of the year.
This year, a challenge is presented to many retailers with the COVID-19 pandemic still at large and growing in many parts of the country. Most annual Black Friday shoppers will want to spend the least amount of time in brick and mortar stores to avoid crowds and possible exposure. Conversely, shoppers will be more likely going to spend a significant amount of time researching online for their purchase needs and wants. As a result, online marketing and ad campaigns for Black Friday promotions are even more important to retailers this year in comparison to previous years.
Using our Ad Intelligence solution, our experts were able to uncover insights into this year’s retail promotions, trends and offers. We were able to collect and analyze the Google shopping ads data of 6,000 highly competitive search keywords from 5 of the most popular Black Friday shopping categories: Apparel and Accessories, Food, Beverage and Tobacco, Electronics, Health and Beauty, and Sports and Outdoors. The following product information and ad data were collected daily from November 9th to 16th, from 4 regions of the US.
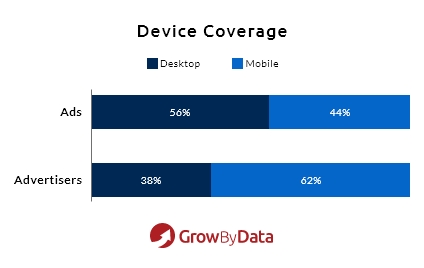
We found 56% of Google Shopping ad impressions during this time period came from desktops, while 44% were from mobile devices. Conversely, 62% of advertisers were found on mobile devices compared to just 38% on desktops, showing competition for advertisers is much higher on mobile devices during the holiday shopping season.
Device coverage
Regional coverage
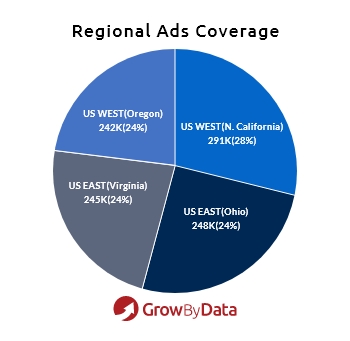
According to our findings, Google Shopping ad impressions were the highest in the California (West) region, at 28%, while the other three regions (N. Virginia East, Ohio East and Oregon West), respectively received 24% of the ad impressions each. Advertiser competition seemed to be pretty evenly distributed across all four regions.
Product price range
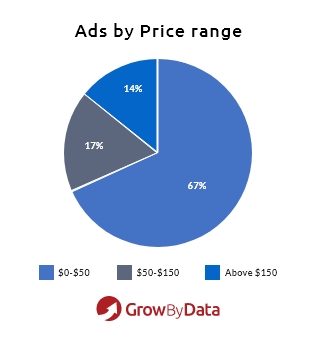
Per our data, the majority of Google Shopping ads were for products priced between $0-50, followed by 17% under $150. Only 14% of ads were for products priced above $150.
Promotional word usage
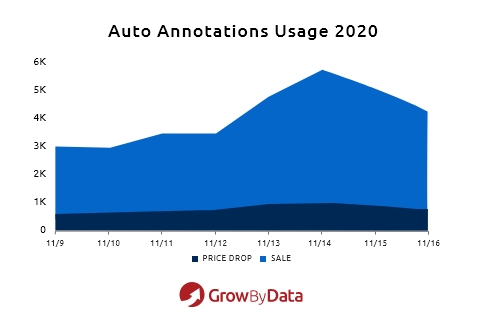
Looking into the promotional annotation usage in Google Shopping ads, ‘Sale’ and ‘Price Drop’ were the two most popular throughout the week. The graph below shows an increase in usage of these annotations on the 13th, 14th and 15th, showing that Google increases the use of these annotations over the weekend.
Shipping annotation usage
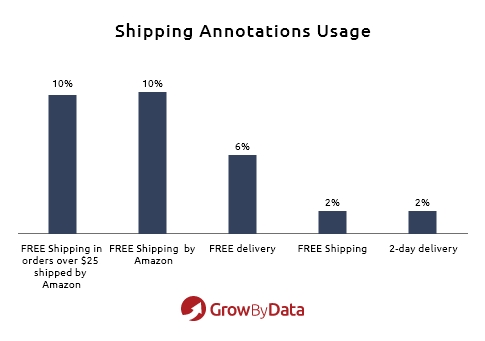
We found 32% of the Google Shopping ads viewed most during our data collection period had a shipping annotation, visible on the graph below. 20% of “Free Shipping” annotations were from product ads for Amazon. The next most used tag was “Free Delivery”, followed by “Free Shipping” and “2-Day Delivery”.
Local inventory ads usage
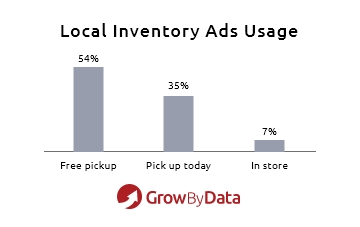
Per our data, over 50% of ads had “Free Pick Up” listed. Another popular choice was the “Pick Up Today” label, used 35% of ads. The label “In Store” came as a distant third, used only in 7% of the ads.
Review and ratings usage
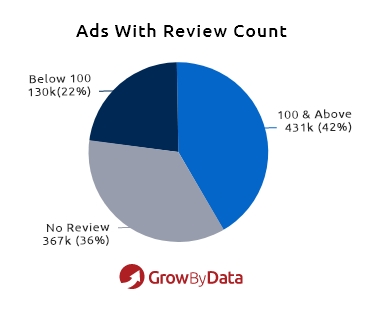
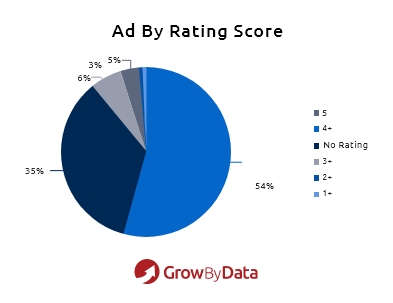
Analyzing the reviews and ratings data, the graphs below showed about 65% of ads had reviews and ratings. 59% of the ratings were above 4. Less than 8% of the ads had a rating of 3 or below. In terms of reviews, 22% of the ads had less than 100 reviews, while 42% of the ads had over 100 reviews.
Promotional offers and codes
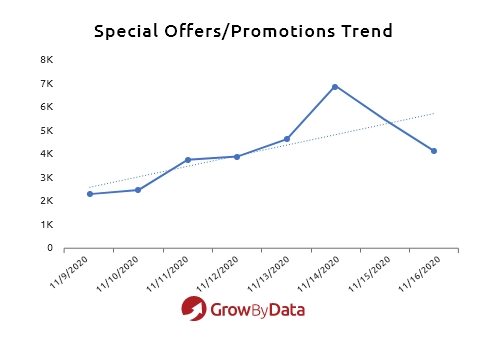
Per our data, 6% of ads we found had special offers. Offer codes such as ‘HOLIDAY20’ and ‘HOLIDAY10’ were among the top 10 most used offer codes. While we did find many offer codes such as ‘BF20’ and ‘CM20’, they were not quite as popular. Looking into the trends of special offers, we found the usage of percentage discounts and limited time offer codes were on an upward trajectory, as shown on the graph below. There seemed to be an even higher increase of special offers during the weekend (13th, 14th and 15th).
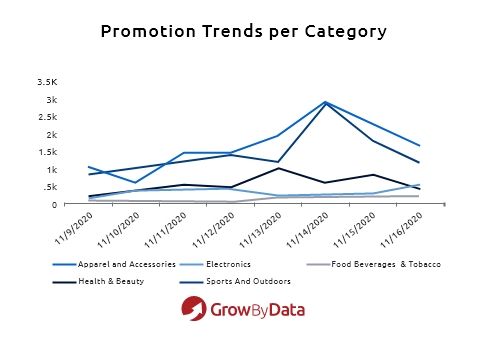
Dissecting the trends of the five categories showed some had a significantly higher promotional usage. Per our data, ads in the “Apparel and Accessories” category and the “Sports and Outdoor” category presented a lot more offers than the other three categories.
Top retailers with special offers
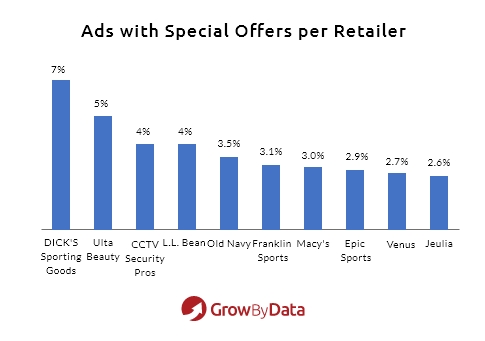
After looking at what the promotional trends per category were, we wanted to find out which retailers were using special promotions the most. The graph below shows Dick’s Sporting Goods had the highest usage of promotions with special offers showing up on 7% of its ads followed by Ulta with 5%. This means shoppers looking for sports products are likely going to find deals at Dick’s Sporting Goods.
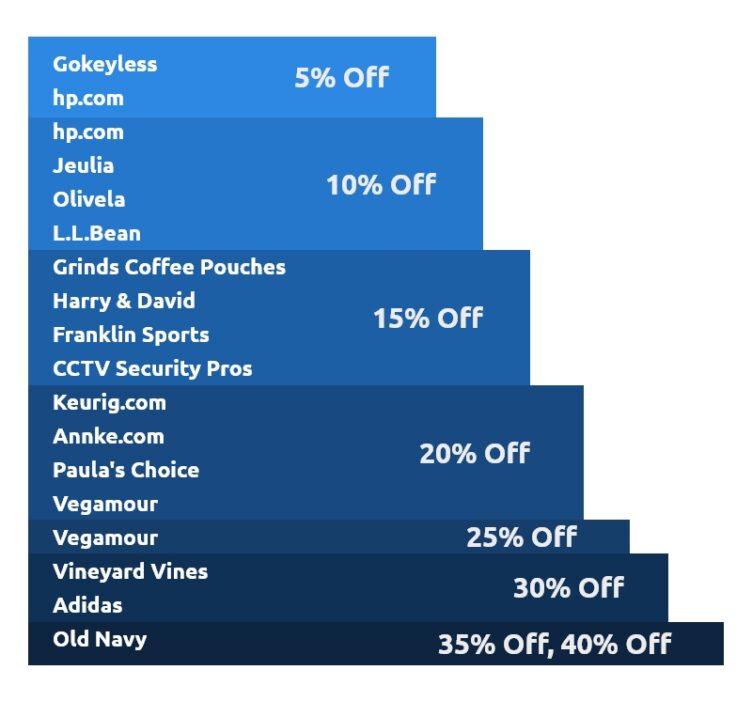
We went a step further to see what kind of special offers were being used by top retailers. The table below shows what kind of special promotions were used by retailers from November 9th to 16th. Retailers like Old Navy, Ulta Beauty, and HP.com, for example, had multiple special promotions running at the same time.
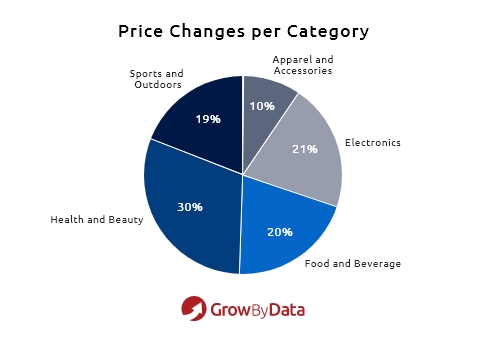
Next, we found out which retailers were changing their prices the most and where shoppers may have the best chance to find the lowest prices. Using GrowByData’s Price Intelligence solution, our experts saw 627,000 price changes from November 9th to 16th, across the 5 categories referenced above. The Health and Beauty category accounted for 30% of the price changes, whereas the Apparel and Accessories category only accounted for 10% of the price changes.
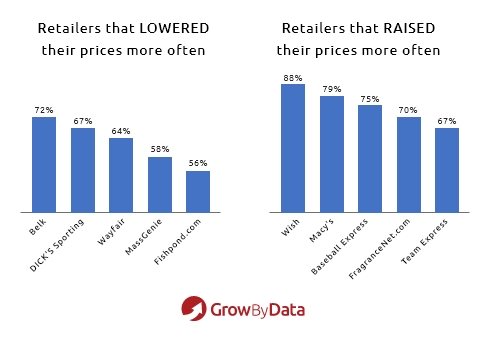
Breaking down the price changes from a retailer category level, we found that “Wish.com” was the retailer who raised their prices the most often, and Belk was the retailer who lowered their prices the most often. As a shopper looking for the best prices, retailers like Belk, Dick’s Sporting, Wayfair etc. presented the best options during this time period.
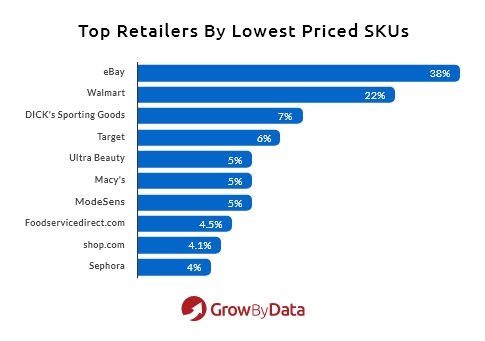
Keep in mind, only looking at the price changes can be deceiving, meaning a retailer could raise the price of a product and still be the lowest priced option versus their competitors. Therefore, we looked at which retailer had the lowest priced SKUs the most often. We found eBay’s products were priced the lowest on almost 40% of their SKUs, followed by Walmart at 22).
Top retailers by lowest priced SKUs
Bringing our data full-circle
Based on our unique data insights above over the past few weeks, available only through GrowByData’s Search Intelligence and Pricing Intelligence solutions, it appears that the best times to find promotional offers for Black Friday savings are on the weekends. In addition, the types of products to find the best promotional offers for are in the Apparel & Accessories and Sports & Outdoors shopping categories. Shoppers looking for the lowest prices on products should do their shopping with online retailers such as Dick’s Sporting Goods, and eBay. Our experts will continue to monitor the latest retail promotional trends through Black Friday and Cyber Monday, into the holiday season. Be sure to look out for our next article with the latest trends in holiday promotions and pricing. Happy Holidays!
GrowByData Article Originally Published at Retail Times on November 25, 2021.
