The main objective of monitoring/tracking ad prices is to adjust your prices accordingly to the market competition, thereby increasing your ad rank, and as a result increasing your impressions, clicks, and sales. This article looks at 3 ways to monitor the price competition of shopping ad campaigns with GrowByData Marketing Intelligence specifically designed to power smarter and faster eCommerce. It examines why you should be tracking the average ad prices for products, the most popular ad price range for your products, and which price segment was most popular (at an auction level) for your products’ category.
Google is the first place most people search for a product and is the most competitive platform of all. Google Algorithm examines and analyzes the search query, estimates what phase of the purchase funnel you fall into, and presents a set of results. If the search is for a product, Google will present the most relevant ads based on their evaluations. There are many factors that Google will consider before showing the list of Google Shopping ads. However, as a customer, price is an important factor in making our purchase decisions. As a result, Google will frequently present ads deemed within an optimal price range, to increase the likelihood of getting a click on an ad.
Below are the 3 simple ways of monitoring price competition in your shopping ads campaign with Google Shopping monitoring solution. The intraday shopping ads capability from your target location down to zip code level with multiple devices using a powerful online marketing intelligence tool ensures you do not lose out on any sales opportunities throughout the day with various insights and alerts.
Monitoring Shopping Ads Average Price Offers
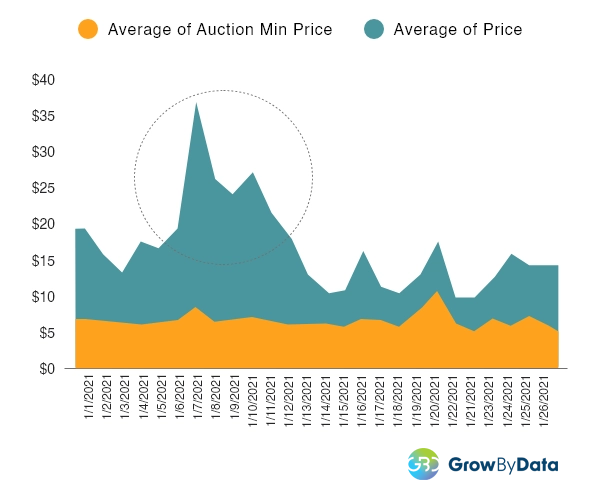
One of our clients reached out to us based on a trend they noticed where they felt like they were seeing some higher prices for their ads in ad auctions. We ran a price analysis, which showed that there was a significant increase in their average prices in the first half of the month. It had increased from a $15 baseline to a $37 average price, between the first and second week.
Drilling down to the granular data showed that several custom products had started to creep into auctions and pushed the average price up. With their average price at times being 5X the cost of the lowest price, their conversions most likely had struggled.
This is a perfect use case where our data can help ‘prove’ marketing hypotheses with real data. Also, the great thing about our data is that we were able to provide them with the product URLs and screenshots of the products in question that had been driving up the prices. To get the biggest benefit of this kind of data, an analysis needs to be performed on a keyword (or a smaller group of keywords) which can be done using our Search Intelligence Software, to make the right decisions for your ad campaigns. Our solution is able to provide on average how other brands are pricing the same products you provide, and where they are ranked on the Google shopping ads auction. Monitoring average prices can help you understand at what prices other brands are successfully attracting customers, in comparison to you.

2. Market Price Analytics
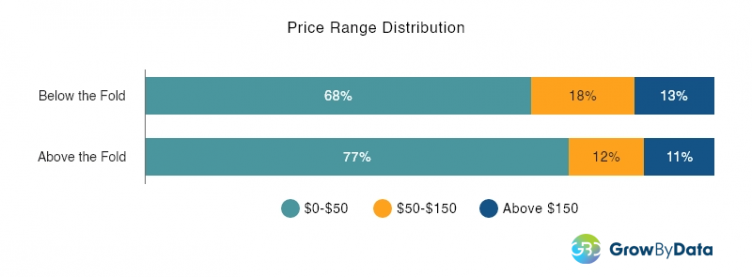
To explain the importance of knowing which price range is most popular in a category, we examined which price ranges were most popular for our selected keywords, as shown in the graph below. We found 77% of the products ‘above the fold’ were in the price range between $0-$50, compared to only 68% shown ‘below the fold’ in this price range. This shows Google prioritizes or prefers showing cheaper products ‘above the fold’ more often.

Stay Ahead with Price Intelligence by GrowByData
Optimize your pricing strategy with real-time competitor insights.