
AI Visibility Index | Running Footwear | June 2026
GrowByData tracks AI brand visibility across 37 non-brand prompts in running footwear, covering ChatGPT, Perplexity, Google AI Mode, and Google AI Overview. This is the first edition of the LLM Intelligence team’s AI Visibility Index, a recurring series tracking how brands show up (or don’t) when consumers ask AI engines what to buy.
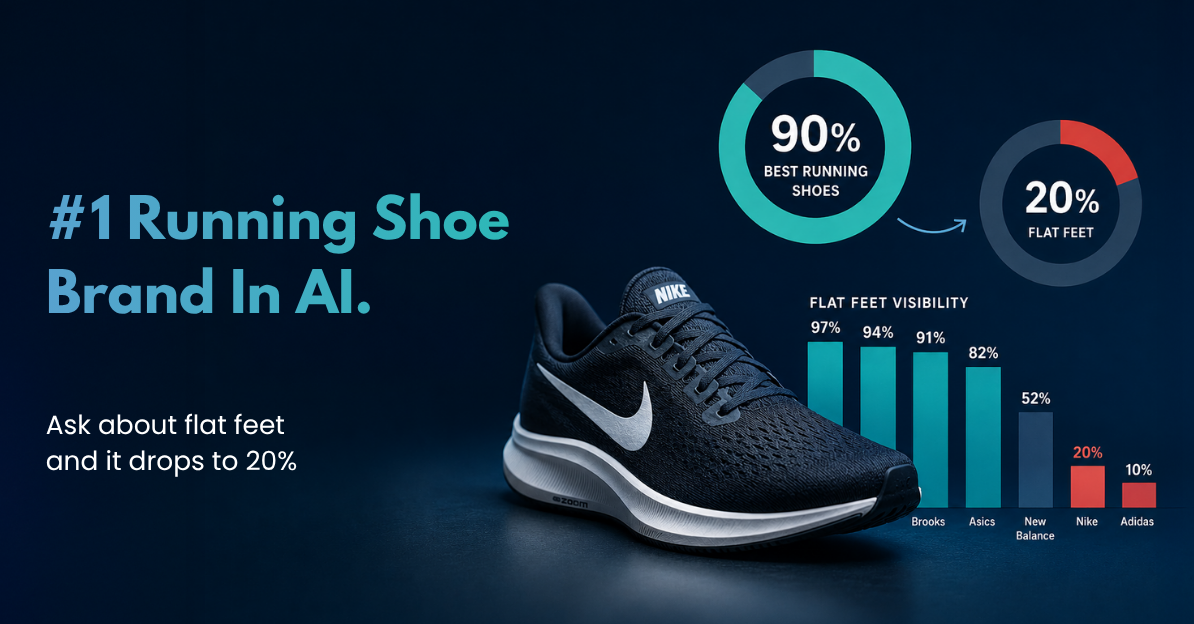
Nike appears in AI running shoe recommendations 90% of the time when someone asks “best running shoes.” On the flat feet prompt, it drops to 20%, ranked sixth, behind Brooks (97%), Asics (94%), Hoka (91%), Saucony (82%), and New Balance (52%).
That’s not a data anomaly. It’s a repeating pattern across the dataset, and it runs in both directions. The same brands that dominate general purchase queries frequently disappear on specific-use prompts. And the brands that are the most visible on prompts related to a person’s specific use often can’t hold that leadership position when the question gets broader (e.g. “best for long distance” does not translate to “best running shoes”).
The Overall Picture
Running is a growing sport. Running USA’s 2025 report confirmed participation increased across every major race distance last year, and the brands competing for that audience are increasingly being evaluated before a runner ever sets foot in a store – with consumers relying increasingly on AI chat engines for guidance.
Across all 37 non-brand running shoe prompts, Nike and Asics are tied at the top, both at 65%. Brooks is at 53%, Hoka at 50%. New Balance, Adidas, and Saucony cluster between 39% and 44%.
| Rank | Brand | Overall AI Visibility |
|---|---|---|
| 1 | Nike | 65% |
| 1 | Asics | 65% |
| 3 | Brooks | 53% |
| 4 | Hoka | 50% |
| 5 | Adidas | 40% |
| 6 | New Balance | 44% |
| 7 | Saucony | 39% |
| 8 | PUMA | 12% |
Nike and Asics are the only two brands that appear on all 37 prompts. Brooks appears on all 37 as well. Hoka and Asics each miss one. New Balance, Adidas, and Saucony are absent from four or five prompts entirely.
The averages look orderly. The prompt-level data doesn’t.
What Happens When the Prompt Gets Specific
Three prompts show it most clearly.
Flat feet
| Brand | Visibility |
|---|---|
| Brooks | 97% |
| Asics | 94% |
| Hoka | 91% |
| Saucony | 82% |
| New Balance | 52% |
| Nike | 20% |
| Adidas | 10% |
Trail running
| Brand | Visibility |
|---|---|
| Hoka | 98% |
| Saucony | 66% |
| Nike | 62% |
| Brooks | 41% |
| Adidas | 12% |
| Asics | 0% |
| New Balance | 0% |
Marathon racing shoes
| Brand | Visibility |
|---|---|
| Nike | 100% |
| Asics | 97% |
| Adidas | 77% |
| Saucony | 76% |
| New Balance | 70% |
| Brooks | 59% |
| Hoka | 47% |
| PUMA | 18% |
The brand set on these three prompts barely overlaps. Asics and New Balance are invisible on trail. Nike and Adidas are irrelevant on flat feet. Brooks, third overall, ranks sixth on marathon racing and doesn’t appear near the top of the trail rankings either.
If you’re tracking brand AI visibility as a single number, you’re averaging together performance that has almost nothing in common across prompts. A brand can be simultaneously dominant and absent depending entirely on the question.
The Specialist vs. General Gap
The clearest pattern is that brands split into two groups depending on what’s being asked.
| Rank | Specialist Prompts | General Prompts | Gap |
|---|---|---|---|
| Nike | 68% | 93% | -25 |
| Asics | 78% | 91% | -13 |
| Brooks | 84% | 59% | +25 |
| Hoka | 79% | 60% | +19 |
| New Balance | 42% | 64% | -22 |
| Adidas | 26% | 72% | -46 |
| Saucony | 56% | 58% | -2 |
| PUMA | 4% | 22% | -18 |
Specialist prompts include flat feet, comfort, durability, beginners, women’s, trail, long-distance, and high arch. General prompts include “best running shoes,” marathon racing, daily training, top rated, and best of 2026.
Nike and Asics do the opposite of Brooks and Hoka: they’re stronger on general purchase prompts than specific-use ones. Adidas has the sharpest version of this pattern: 26% on specialist prompts, 72% on general ones. It essentially doesn’t exist in the specific-use layer but holds a reasonable position on open-ended purchase queries.
Saucony is the outlier: nearly identical performance on both sides, but it shows up in fewer places overall. It scores 84% on durability and 80% on marathon training, then 23% on comfort and 0% on walking, budget, break-in, and in-store vs. online. AI engines associate Saucony with endurance and durability, and not much else.
Three Brands Worth Looking at Closely
Brooks has the most defined lane of any brand in the dataset. It leads the category outright on five prompts: beginners (98%), flat feet (97%), comfort (97%), durability (92%), and women’s (95%). On every one of those, it beats both Nike and Asics. On marathon racing it drops to 59% and ranks sixth. On “best running shoes” it sits at 61%, third overall but 32 points behind Asics. AI engines know exactly what Brooks is for, and they reach for it consistently in those contexts. Outside them, less so.
Hoka owns a lot of specific-use territory but doesn’t show up the same way when someone just asks which shoes to buy: 98% on trail, 96% on women’s, 91% on flat feet and comfort. But its general prompt floor is lower: 53% on “best running shoes,” 47% on marathon racing, 36% on marathon training, and absent entirely from budget queries. Hoka’s AI presence is wide across specialist categories but doesn’t consolidate into general purchase authority the way Nike and Asics do. For a brand that has grown as aggressively as Hoka has in recent years, that gap between category dominance and general recommendation rate is worth watching.
Saucony is narrower still. Its two strongest prompts are durability (84%, ranked second) and marathon training (80%, ranked third), both endurance-oriented and consistent with how the brand has historically positioned itself. Outside endurance, it largely disappears: 23% on comfort, 35% on beginners, and zero on walking, budget, and several advisory prompts. On “best running shoes” it sits at 47%, seventh in the category. Saucony’s footprint is focused but narrow. It wins in a specific niche. Whether that niche is wide enough depends on the queries that actually drive purchase decisions.
Platform Differences
Across all four AI engines, the general direction of brand rankings holds. But the gaps between them are large enough that brands should think carefully about their strategy across LLMs rather than treating “AI visibility” as one score. For how the term is defined and measured, see what AI visibility means for a brand.
| Platform | Nike | Asics | Brooks | Hoka | Saucony |
|---|---|---|---|---|---|
| ChatGPT | 68% | 76% | 69% | 59% | 47% |
| Perplexity | 64% | 52% | 62% | 47% | 52% |
| Google AI Mode | 56% | 58% | 39% | 50% | 25% |
| Google AI Overview | 54% | 59% | 36% | 37% | 23% |
ChatGPT and Perplexity produce meaningfully higher visibility scores for most brands than Google AI Mode and Google AI Overviews. The Google surfaces pull from a narrower source set and favor a shorter list of brands.
For Brooks and Saucony the Google AI surface gap is significant: Brooks at 36% to 39% on Google versus 62% to 69% on ChatGPT and Perplexity, Saucony at 23% to 25% versus 47% to 52%. Asics runs the other direction: 76% on ChatGPT, its highest score on any platform. That gap traces to two things: its own regional sites (US, UK, AU, JP, and others) show up across roughly 50 cited URLs in ChatGPT’s source pool, and Tom’s Guide and RTINGs both cover Asics heavily across multiple reviews and roundups.
The source layer explains most of this. The five most-cited domains across the two highest-intent prompts are RunRepeat (9% citation share), Runner’s World (6%), Outdoor Gear Lab (6%), Fleet Feet (5%), and RTINGs (3%). RunRepeat alone accounts for 22% of citations on Google AI Overview. Fleet Feet’s buyer guides account for 13%. A brand’s visibility on Google’s AI surfaces is largely a function of how prominently it appears in those specific sources, in those specific formats: ranked lists and buyer guides, not how well-covered it is in the running press generally.
What Should Brand Marketers Do With This Data?
A few things the data makes hard to ignore.
- AI engines don’t have a single opinion about your brand. They have different opinions depending on the question. A brand can be the top recommendation for flat feet and sixth for marathon training. Knowing where you show up and where you don’t, at the prompt level and not just overall, is where you have to start.
- Specialist authority and general purchase authority are different assets. Make sure you are creating the right content and conducting PR outreach for your niche and/or for general purpose “best of” sources.
- The source funnel is narrow and format-specific. The top five cited domains account for the large majority of AI recommendations in this category. Getting covered in those sources matters less than getting covered in the right formats within them. RunRepeat’s round-up guides and Fleet Feet’s buyer pages: those specific content types are what Google AI Overview and Google AI Mode are pulling from. General editorial coverage doesn’t substitute for structured, rankable, buyable-format coverage in the right places.
- Platform gaps are specific, not uniform. If you’re at 60% on ChatGPT and 35% on Google AI Overview, those aren’t the same problem. Google’s AI surfaces pull heavily from buyer guides and ranked lists. RunRepeat alone accounts for 22% of citations on Google AI Overview. Getting into the sources that influence each engine is a different task than earning general press coverage.
- Map your prompts before you do anything else. Most brands don’t know which specific prompts they’re absent from. They just have an overall visibility number, and that number tells you almost nothing useful. Nike is #1 overall and sixth on flat feet. If you don’t know your prompt-level AI search visibility gaps, you don’t know what you’re actually trying to fix, based on IAB’s research on AI-influenced shopping.
Most Brands Don’t Know Their Prompt-Level Gaps Until They Check
See where your brand shows up in AI search, and where it quietly disappears, across ChatGPT, Perplexity, Google AI Mode, and Google AI Overview.
The AI Visibility Index tracks brand presence across AI engines at the prompt level using proprietary data from GrowByData. Data covers ChatGPT, Perplexity, Google AI Mode, and Google AI Overview across 37 non-brand running footwear prompts.