

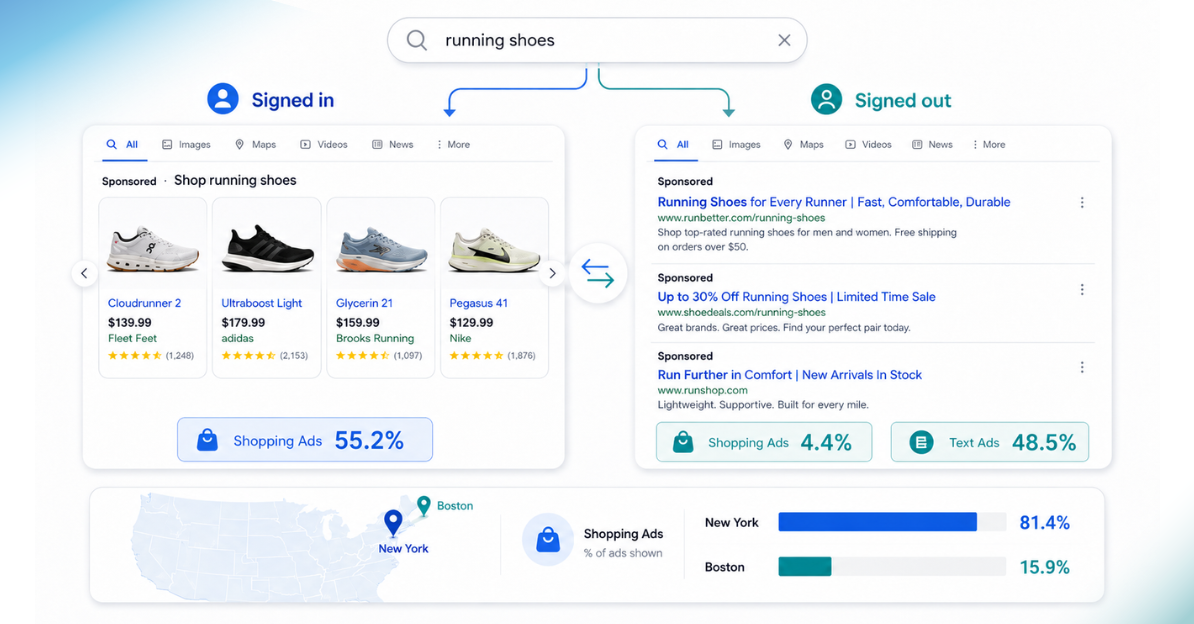
Key takeaways
➤ Shopping Ads appeared in 55.2% of logged-in retail searches but only 4.4% of logged-out ones, where Text Ads climbed to 48.5%. Someone browsing without a Google account is probably seeing a different ad format than your reports suggest.
➤ On the same keywords, Shopping Ads appeared in 81.4% of New York searches and 15.9% of Boston searches. A national report averages that 65-point gap away.
➤ The two formats mostly showed up together rather than replacing each other, and logged-out Text Ad rates ran from 54% in Atlanta down to 11% in New York.
Search “running shoes” on Google and you will probably get a row of product images with prices across the top of the page. A colleague running the same search on the same day can get a plain text ad instead: headline, URL, two lines of description. Same keyword, same day, different ad.
We kept seeing this in our own scans, so in June 2026 we ran the same retail keyword set twice, once logged in to a Google account and once logged out, across New York, Boston, and 12 other US cities. The two runs barely looked like the same keyword set.
|
55.2% of retail searches showed Shopping Ads when the user was logged in to Google |
48.5% of retail searches showed Text Ads when the user was not logged in |
81.4% of New York retail searches showed Shopping Ads, versus 15.9% in Boston |
Shopping Ads vs Text Ads: the basic difference
A Shopping Ad is the product carousel at the top of a Google search: product photos, prices, star ratings, store names. A Text Ad is the older format, a clickable blue headline with a green URL and two or three lines of description underneath.
Plenty of retailers run both at once. What is less obvious is when Google decides to show one instead of the other, and whether that decision is the same for everyone searching. In this data it was not.
Logged-in and logged-out searches returned almost opposite results
The logged-in scan simulates a shopper logged into a Google account with search history behind them. Logged in, Shopping Ads appeared in 55.2% of retail searches and Text Ads in 1.4%. Logged out, Shopping Ads dropped to 4.4% and Text Ads climbed to 48.5%. The two formats more or less traded places.
| Ad format | Logged in | Logged out (automated) |
|---|---|---|
| Shopping Ads | 55.2% | 4.4% |
| Text Ads | 1.4% | 48.5% |
Left column: logged-in manual scan (New York and Boston). Right column: automated logged-out scan (12 US cities). Source: GrowByData, June 2026.
Google appears to serve Shopping Ads far more often to people it can identify, meaning users logged in with an account and a history attached to it. For anonymous visitors it fell back to Text Ads. If your customer has never logged into Google, or is shopping in a private window, the ad they see may not be the format your campaign reports would lead you to expect.
We cannot tell from SERP visibility data alone what is causing that. Google may need account and history signals to work out which Shopping Ads are relevant, and default to Text Ads without them. Or advertisers have already built their campaigns around logged-in audiences, so Shopping Ads never enter the auction for anonymous visitors in the first place. Both could be true at once, each narrowing the anonymous auction a little further. A SERP scan cannot separate those, and we would rather say so than pick one.
On the rare logged-in searches where Text Ads appeared, Shopping Ads were almost always present too. The real substitution isn’t between the two formats on a single page; it’s between logged-in and logged-out users.
Location changed Shopping presence more than anything else we measured
On this keyword set, Shopping Ads showed up in 81.4% of New York retail searches, even for logged-in users. In Boston, same keywords, presence sat at 7% at the start of the scan window. That is a 65-point gap.
Boston did not stay there. In just six days, the presence rate climbed to 39.5%, while New York barely moved. Nothing else we measured, not the keyword, not the login state, moved Shopping presence as far as the city did.
| Date | Shopping Presence Boston (Logged-in) |
Shopping Presence New York (Logged-in) |
|---|---|---|
| Jun 15 | 7.0% | 76.7% |
| Jun 17 | 0.0% | 51.2% |
| Jun 19 | 11.6% | 97.7% |
| Jun 21 | 16.3% | 90.7% |
| Jun 23 | 20.9% | 76.7% |
| Jun 25 | 39.5% | 97.7% |
Boston was not scanned on Jun 13, 14, or 27; New York was scanned on every date. Source: GrowByData manual logged-in scan, June 2026.
Why the gap exists is harder to answer. Fewer advertisers may be bidding on Shopping placements in Boston for these keywords, or Google may be reading commercial intent differently by market. The scan can only show the result: change the city, and the page changes with it.
If you run Shopping campaigns nationally and only check performance at the national level, a market like Boston can be close to invisible while the blended report looks fine. You could be spending where Shopping Ads rarely appear, or missing one where they are starting to show up. One caveat: the Boston figures rest on 41 instances across six dates. Enough to notice, not enough to move budget on. Give it another scan cycle first.
Text Ad competition runs heaviest outside New York
In the logged-out scan across 12 US cities, Text Ad presence varied a lot by market. Atlanta showed Text Ads in 54% of searches, Chicago 47%, Dallas 44%. New York sat at 11%.
| City | Text Ad presence (logged-out) |
|---|---|
| Atlanta | 54% |
| Chicago | 47% |
| Dallas | 44% |
| New York | 11% |
Automated logged-out desktop scan, June 2026. Source: GrowByData.
New York came in low on Text Ads in both scans, so it is the market, not our method. The practical read for retail advertisers is that Text Ads carry more competitive weight in mid-sized markets than they do in New York. If your Atlanta numbers look nothing like your New York numbers, that may be the market rather than the campaign.
The competitors you see depend on which view you look at
In the logged-in scan, 5 of the 13 brands that ran a Text Ad also ran a Shopping Ad on the same keyword, same date, same city. A specialty apparel retailer and several beauty brands were among them.
The logged-out scan turned up a different cast. Desktop searches leaned toward custom-printing companies and direct-to-consumer brands. Mobile was different again, with subscription and marketplace services appearing.
So the competitors you see in Shopping may not be the ones you see in Text Ads, and neither list stays the same once you switch login state. One view won’t show you that. Some brands run both formats at once, and others are all over Text Ads while being absent from Shopping entirely.
What this means for your retail advertising
Four questions this data raises, and what the numbers suggest:
| Question | What the data suggests |
|---|---|
| Are my Shopping Ads reaching logged-out customers? | Probably not. Shopping Ads appeared in 4.4% of logged-out searches against 55.2% logged in. A first-time visitor in a private window may be looking at a competitor’s Text Ad. |
| Should I run both Shopping Ads and Text Ads? | On most retail keywords, yes. Shopping dominates for logged-in users and Text Ads cover the rest. The brands running both were not treating it as a choice between them. |
| Why do my Shopping Ads perform differently by city? | Presence ran 81.4% in New York against 15.9% in Boston on identical keywords. Where performance differs by market, the page itself often looks different too. |
| Is Text Ad competition different across markets? | Yes. Atlanta at 54% ran roughly five times New York’s 11%. Benchmarking a national campaign against New York will understate competition in mid-sized markets. |
Standard tools also sample the page differently from the way a real shopper sees it, which we covered separately in our look at the Google Shopping Ads blind spot. What this scan adds on top of that is which format appeared, in which market, and for which kind of user.
How to track this on your own keywords
Most SERP tracking reports at the keyword level. The differences in this piece only surface once you break the data down by location, login state, and domain.
GrowByData’s local and international SERP monitoring tracks widget presence by region and the domains winning each one. For Shopping specifically, Google Shopping Ads monitoring covers presence, competitors, and product-level data by market, and our Google Share of Voice methodology explains how presence and competitive share get measured in the first place.
How we measured this
GrowByData tracked 645 logged-in desktop searches across New York and Boston (June 13-27, 2026) and 25 automated logged-out searches per day across 12 US cities on desktop and mobile (June 13-29, 2026). Both scans used the same retail keyword set. The logged-in scan simulates an authenticated shopper, the automated scan an unauthenticated or incognito visitor.
These are two different populations of real searches rather than a controlled experiment, so the comparisons are directional signals, not proof. The 55.2% logged-in, 81.4% New York, 15.9% Boston, and co-occurrence figures come from the manual logged-in scan. The 4.4% logged-out, 48.5% logged-out, and city-level Text Ad rates come from the automated scan.
See what your customers actually see when they search
GrowByData tracks which ad formats show up on your retail keywords, in your markets, for logged-in and logged-out users, so you can check what your buyers are looking at instead of assuming.