
If your Google Shopping campaigns are losing clicks, the problem usually isn’t your bids.
In the apparel vertical in Q1 2026, one advertiser’s Shopping Ads share of voice surged from under 10% to over 80% in a single day then collapsed back to baseline within 48 hours. Teams without continuous google shopping competitive intelligence saw this only in its aftermath: higher CPCs, compressed impression share, unexplained revenue dips. Teams monitoring SOV daily saw it the moment it started.
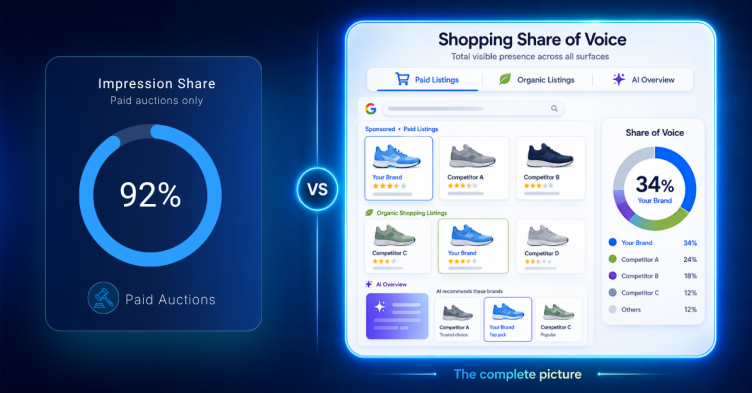
That’s the gap this article addresses. Google Auction Insights tells you how often a competitor appeared. It does not tell you when they’re about to flood your category, what they’re showing shoppers, or why their listing won the click instead of yours.
What follows is a complete framework for PLA competitor analysis built on real Share of Voice data, separated across Shopping Ads and organic Merchant Listings, enriched with product-level merchandising intelligence. Including how dedicated shopping ads monitoring tools like GrowByData compare to what Semrush and Similarweb actually deliver.
Why Google Auction Insights Isn’t Enough for PLA Competitor Analysis
Auction Insights was designed for text ads. Applied to Product Listing Ads, it gives enterprise teams a dangerously incomplete picture.
Here is what it shows: overlap rate, outranking share, impression share, position above rate.
Here is what it hides: the visual reality of the carousel your shoppers actually see.
Two competitors can have identical impression share numbers while one dominates the top row of the mobile shopping grid with a price-drop badge, a 4.8-star rating, and a free shipping label and the other sits below the fold with none of those attributes. The conversion difference between those two listings can be 3-5×. Auction Insights shows no difference between them.
For performance marketing and paid search teams managing seven-figure Shopping budgets, this creates three blind spots that cost real money:
- Competitor surges you miss entirely. A single advertiser running a concentrated promotional burst can surge from single-digit SOV to over 80% in your core category in 24 hours. By the time your weekly reporting cycle catches it, the campaign is already over and your CPC damage is done.
- Device-level gaps you can’t see. A balanced desktop carousel becomes a single-brand scroll on mobile. A competitor dominating mobile Shopping positions is effectively invisible in blended desktop-first reports while winning your customers’ screens where it matters most.
- Attribute-level blind spots. Standard tools confirm a competitor is ranking. They don’t surface why their listing is winning clicks. A free shipping badge added Tuesday, a price-drop annotation from a 3% price cut, a competitor shifting coverage from paid to free shipping, these are the CTR levers that Auction Insights never shows.
The Two PLA Competitive Battlegrounds You Must Track Separately
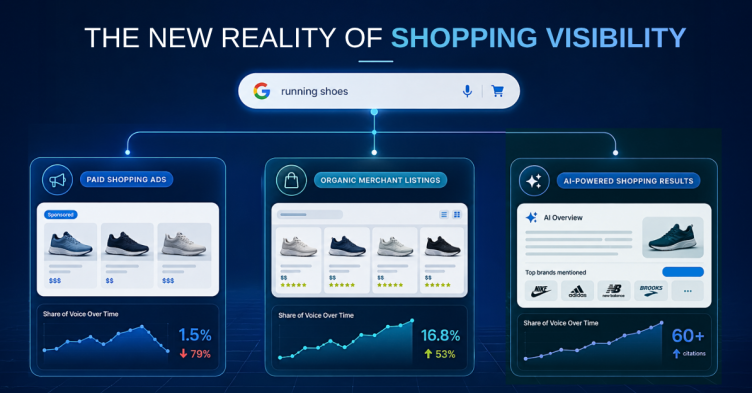
Most teams treat Google Shopping as a single channel. It isn’t. Google Shopping Ads (paid) and Google Merchant Listings (organic) are two distinct competitive landscapes with different dominant players, different optimization levers, and different strategic responses.
In Q1 2026 apparel data tracked through GrowByData:
Shopping Ads vs. Merchant Listings: The Competitive Sets Are Almost Entirely Different
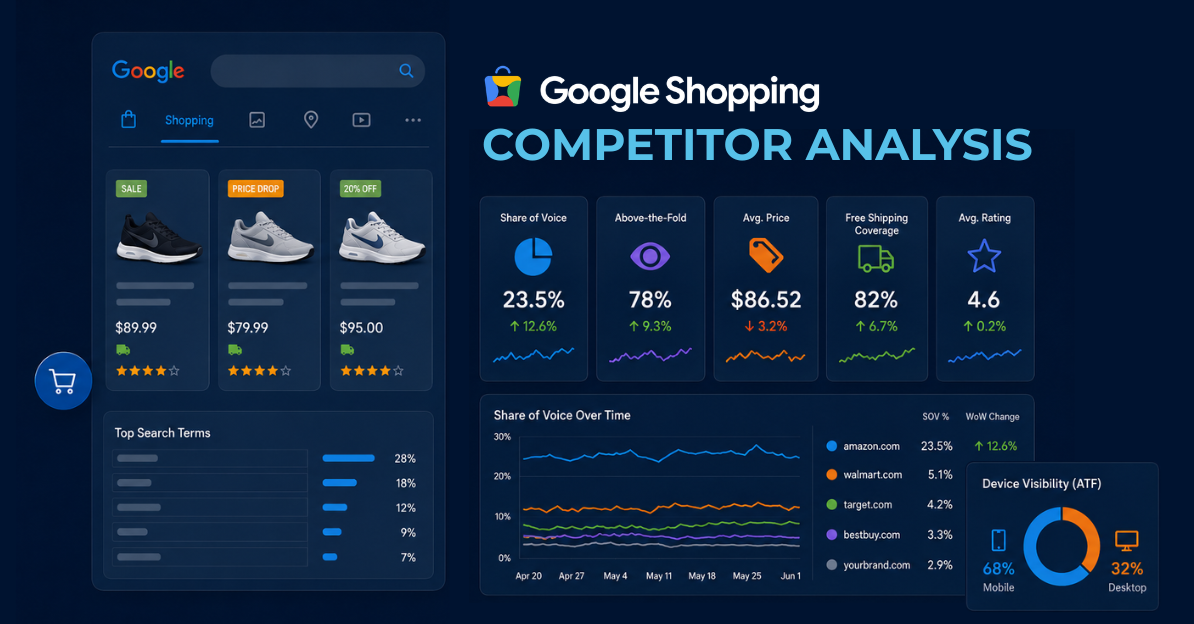
A complete Google Shopping competitive intelligence framework works across five layers. Each layer answers a different strategic question.
Shopping Ads: Top Advertisers (Apparel, Q1 2026)
| Brands | SOV% | Avg. Price |
|---|---|---|
| SHEIN | 5.5% | $12.1 |
| Quince | 3.6% | $88.3 |
| Target | 1.9% | $23.1 |
| Prada | 1.9% | $2719.9 |
| Temu | 1.7% | $16.2 |
Merchant Listings: Top Sellers (Apparel, Q1 2026)
| Brands | SOV% | Avg. Price | Free Shipping |
|---|---|---|---|
| H&M | 13.3% | $23.6 | 71.2% |
| GAP | 7.1% | $44.9 | 68.2% |
| Abercrombie | 6.8% | $83.0 | 37.4% |
| Macy’s | 6.4% | $17.2 | 0.0% |
| Dick Sporting Goods | 4.5% | $58.7 | 20.6% |
This divergence is the insight that changes budget decisions. If H&M holds 13.3% Merchant Listings SOV in your category but barely registers in paid Shopping Ads, increasing your Shopping bids is fighting the wrong battle. And if Temu is running 50.7% free shipping coverage in paid while your brand shows 0%, that’s a paid merchandising gap, not an organic problem.
Budget decisions made on blended paid-and-organic visibility data consistently misallocate spend. Tracking these channels separately is the foundation of a competitive strategy that doesn’t.
→ What Is Google Share of Voice and How to Calculate It
4 Layers of a Complete Google Shopping Competitor Analysis
Layer 1: Share of Voice by Category, Tracked Daily
Share of Voice in Google Shopping measures how often a competitor’s listings appear across the full universe of relevant queries in your category not just the keywords you’re already bidding on.
This matters because Auction Insights impression share is capped to auctions you entered. SOV tracks the entire landscape, including auctions where your products never placed a bid. A competitor holding 13% Merchant Listings SOV in your core category is winning more than one in eight organic product impressions across every relevant search including searches you’re completely invisible for.
The GrowByData platform captures SOV across Shopping Ads and Merchant Listings independently, with daily granularity. In the apparel data: Shein averages 6.5% paid Shopping Ads SOV for the quarter but when filtered to specific subcategories or high-intent keywords, that concentration can be dramatically higher. Category-level SOV tells you who the dominant players are. Keyword-level SOV tells you exactly where the battle for your margin is happening.
Layer 2: Historical Visibility Trends: The Early Warning System
The search landscape doesn’t shift gradually. It spikes and the spikes are where the damage happens.
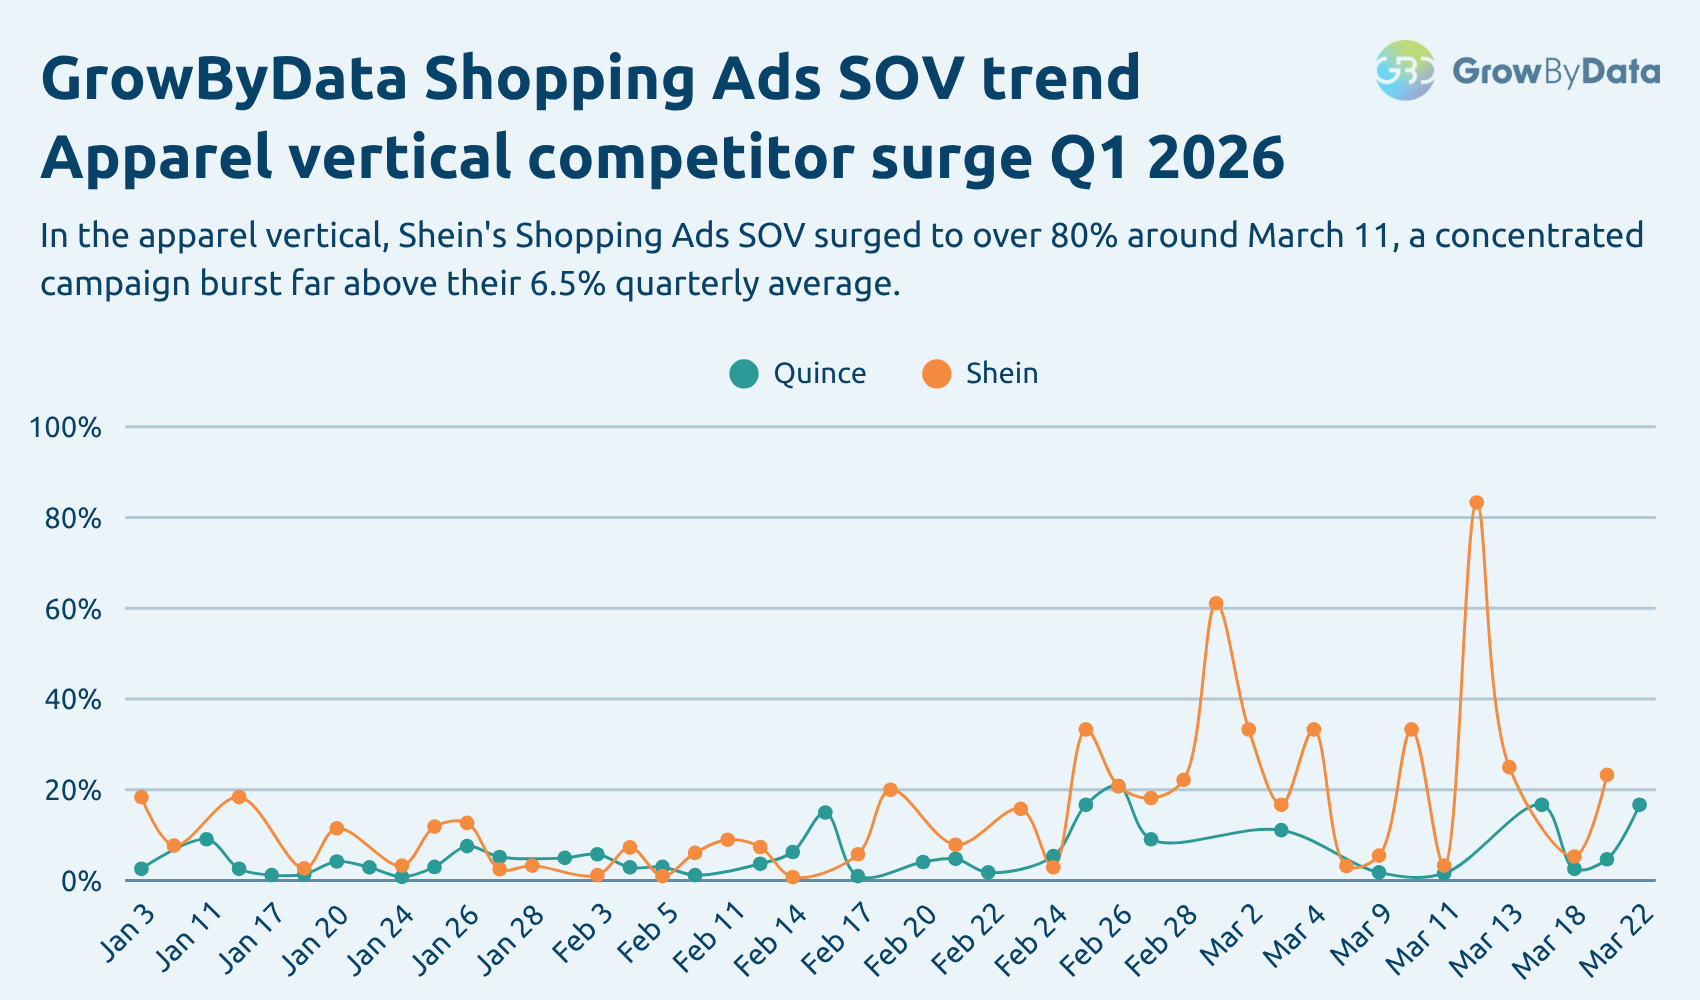
In the apparel Shopping Ads data for Q1 2026, Shein’s average quarterly SOV is 6.5%. But on a single day in early March, their daily SOV reached over 80%, a 12x burst concentrated into a 24-48 hour window. This is the competitive event that breaks weekly reporting. The brands that detected it in real time could respond: adjusting bids, accelerating promotions, understanding why their own visibility suddenly compressed. The brands on weekly reporting cycles saw only the aftermath.
Historical trend data also reveals strategic behavioral patterns: which advertisers invest heavily around key retail moments and then pull back, which brands are quietly expanding into new subcategories, which are contracting. For quarterly budget planning and competitive review cycles, these patterns are more actionable than any single-day snapshot.
Layer 3: Product-Level Merchandising Intelligence
Winning a click from a Shopping carousel is a visual competition decided in under a second. The shopper scans product image, price, retailer name, and trust signals. The listing with the most compelling combination wins regardless of bid.
Shopping Ads Comparison: Shein vs Quince
| Brands | Avg Discount | Price Drop | Sale | Shipping (Paid) |
|---|---|---|---|---|
| Shein | 57.3% | 4.1% | 1.8% | 62.3% |
| Quince | 7.1% | 0% | 0% | 73.6% |
This is where google shopping spy analysis moves from impression data to actual competitive intelligence: knowing exactly what attributes your competitors are showing and why their listing is beating yours.
The Compare Annotations view in GrowByData surfaces these attribute differences side by side across any two competitors in your category:
- Discount and promotional coverage: who is running Sale, Price Drop, or Special Offer annotations, at what depth, and for how long
- Shipping signals: what percentage of listings carry free shipping, free minimum order, or expedited labels; in apparel, Temu runs 50.7% free shipping against brands showing 0%
- Return policy annotations: Days Return 90 Plus, Lifetime Returns, visible attributes in high-consideration purchase categories
- Rating and review depth over time: a listing with 9,000 reviews at 4.8 stars will outperform one with 9 reviews at the same rating on almost every high-intent query
This is what bridges the gap between knowing a competitor is outperforming you and understanding exactly why. Without it, optimization decisions are guesses. With it, they’re targeted responses to specific, measurable competitive gaps.
Layer 4: Carousel Position and SERP Feature Context
Share of Voice tells you who’s winning within a channel. SERP feature presence tells you how much that channel matters in the first place.
This is the layer most performance marketing teams skip entirely and it’s where some of the most consequential strategic errors happen.
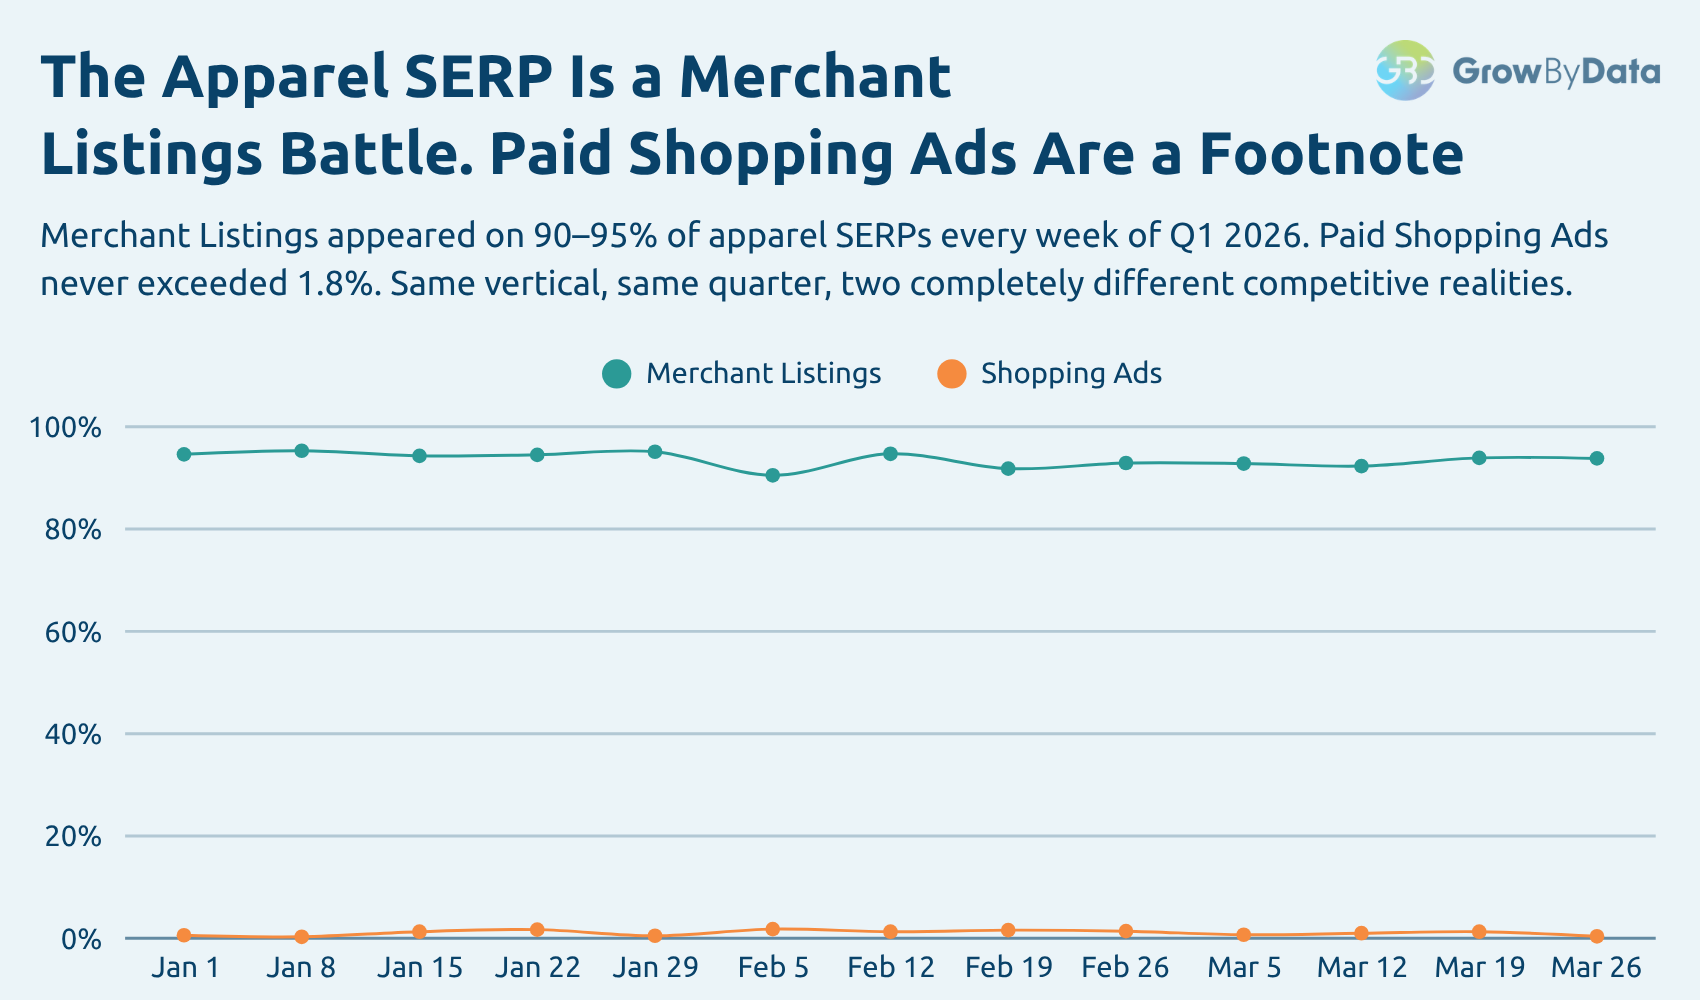
This data reframes the entire competitive conversation. Merchant Listings is a near-permanent fixture of apparel SERPs present on 9 in 10 searches throughout the quarter with almost no weekly variation. Paid Shopping Ads is a marginal feature that never broke 2% presence in any given week.
The strategic implication is direct: in the apparel vertical, organic Merchant Listing optimization is not a secondary priority to paid Shopping Ads management. It is the primary visibility battle. A brand that spends 80% of its monitoring effort on paid Shopping Ads and 20% on Merchant Listings has those proportions exactly backwards relative to where Google is actually surfacing product listings to shoppers.
Shopping Ads and Merchant Listings also don’t compete in isolation they sit alongside organic results, AI Overviews, People Also Ask, Images, Maps, and a dozen other feature types that collectively determine how much SERP real estate any single feature controls.
How GrowByData Compares to Semrush and Similarweb for Shopping Intelligence
Most enterprise teams already have Semrush or Similarweb in their stack. Both are strong for keyword research and domain-level traffic analysis. Neither was designed for google shopping competitive intelligence at the product and listing level.
The core difference is data methodology. Semrush and Similarweb derive Shopping visibility estimates from sampled panel data or algorithmic modeling. GrowByData captures data from live SERP scans, the actual carousels real users see, across devices, geographies, and times of day. That’s what makes attribute-level intelligence possible. You cannot infer a 57.3% discount rate or a free shipping badge from traffic estimates.
| Capability | SEMrush | Similarweb | GrowByData |
|---|---|---|---|
| Shopping Ads SOV tracking | Limited: text ad focused | Domain traffic estimates only | ✓ Full PLA SOV, daily granularity |
| Merchant Listings SOV tracked separately | ✗ | ✗ | ✓ Independent channel tracking |
| Historical SOV trends (90+ days) | ✗ | Limited | ✓ Daily, weekly, monthly, quarterly |
| Carousel position tracking (ATF vs. BTF) | ✗ | ✗ | ✓ Per-advertiser, per-keyword |
| Merchandising annotation comparison (discount, shipping, returns) | ✗ | ✗ | ✓ Side-by-side attribute comparison |
| Ratings and reviews over time | ✗ | ✗ | ✓ Full trend tracking |
| SERP feature presence (Shopping vs. Merchant Listings vs. AI Overview) | Partial | ✗ | ✓ Full SERP feature breakdown ATF/BTF |
| Data source | Estimated / sampled | Panel-based estimates | ✓ Live SERP scans |
If your primary use case is shopping ads monitoring, PLA share of voice, google shopping spy analysis, merchandising attribute tracking, Merchant Listings coverage, GrowByData is purpose-built for that layer. It complements your existing SEO and keyword tools rather than replacing them.
The Bottom Line
Standard Google Shopping reporting wasn’t built for the competitive intensity enterprise brands now face.
Your Auction Insights report cannot tell you when a competitor is about to surge to 80% share of voice in your category overnight. It cannot tell you that the brands dominating your paid Shopping carousel are an entirely different competitive set from the brands dominating your organic Merchant Listings and that each requires a completely different response. It cannot tell you whether Shopping Ads even appear on 2% or 90% of the SERPs your customers are actually seeing.
The apparel data in this article isn’t an edge case. It’s what the Google Shopping landscape looks like when you measure it properly with channel-separated SOV, daily historical trends, product-level merchandising intelligence, and full SERP feature context. Every vertical has its own version of this story. The brands that know their version are making fundamentally different decisions than the ones still relying on Auction Insights and blended reporting.
A complete Shopping Ads competitive intelligence practice gives your performance marketing team the full picture of the SERP your customers actually see, not a filtered slice of the auctions you already entered. That visibility is what separates reactive bid management from a strategy that actively protects margin and captures share.
Want to see what this looks like for your own category?
See your Google Shopping SOV, competitor visibility gaps, and top threats for your own category.
→ Related: What Is Competitive SERP Analysis and Why It Matters
→ Related: What Is Google Share of Voice and How to Calculate It
Frequently Asked Questions
What is Google Shopping Share of Voice?
A: Google Shopping Share of Voice (SOV) measures how often a brand’s product listings appear across all relevant Shopping queries in a category, both paid Shopping Ads and organic Merchant Listings. Unlike Auction Insights impression share, SOV covers the full auction landscape including queries a brand never bid on.
How do you spy on Google Shopping competitors?
A: A google shopping spy analysis tracks competitor Share of Voice, product-level pricing, promotional annotations (sale badges, price drops, free shipping labels), carousel position, and historical visibility trends. Tools like GrowByData capture this from live SERP scans rather than estimated panel data.
What’s the difference between Google Shopping Ads and Merchant Listings?
A: Shopping Ads are paid placements in the Google Shopping carousel managed through Google Ads. Merchant Listings are free organic product listings from Google’s Shopping Graph. The competitive sets in each channel are often entirely different brands, requiring different optimization strategies and separate SOV tracking.
Why is Google Auction Insights not enough for PLA competitor analysis?
A: Auction Insights only shows performance for auctions your brand entered, and provides no data on competitor pricing, promotional badges, shipping labels, ratings, or carousel position. It cannot detect sudden competitor SOV surges or distinguish above-the-fold from below-the-fold placement.