
Google Shopping share of voice measures how much of the visible Shopping results your products actually own against the competitors chasing the same shoppers. Not how many impressions you served. How much of the shelf you hold. That distinction is where most retail teams lose the plot, because they’ve spent years optimizing impression share and quietly assuming it means the same thing. It doesn’t.
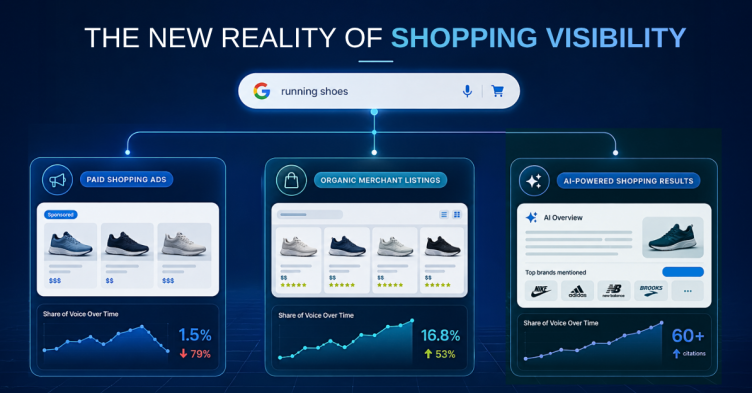
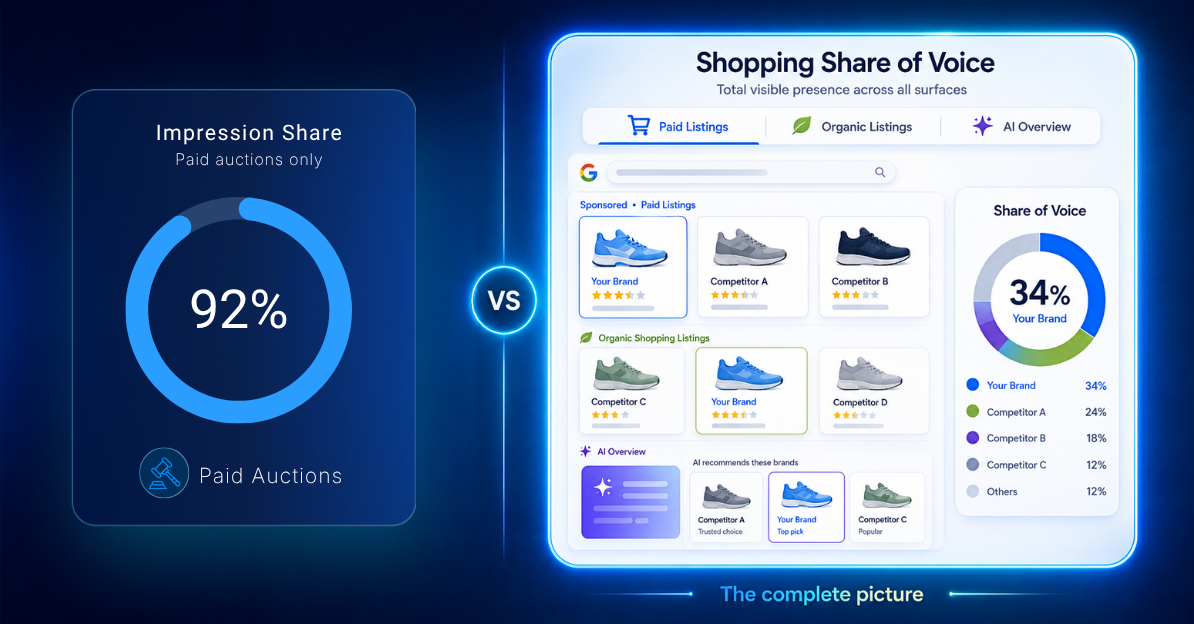
Impression share tells you how often you showed up in the auctions you entered. Google Shopping share of voice tells you how visible you are across the whole results page, including the auctions you never entered, the organic listings sitting above your ads, and the AI Overviews now pushing paid rows further down. One is a slice. The other is the picture.
What is Google Shopping share of voice?
Google Shopping share of voice is your brand’s proportion of total visible presence in Google Shopping results for a given set of products, keywords, and markets, measured against every competitor appearing alongside you.
Put simply: if ten brands compete for a query and your products occupy three of the visible listing slots, your share of voice is roughly 30 percent for that query. Track that across your product catalog, your chosen markets, and your target devices, and you get a presence score that reflects what a shopper actually sees.
Here’s the line that matters, and the reason this page exists separately from how share of voice is calculated across organic search: Shopping share of voice is surface-specific. It’s not organic ranking. It’s not generic keyword visibility. It’s the competitive shelf inside Google Shopping, paid and organic listings together, scored as a percentage you can defend in a QBR.
Why impression share isn’t the same as share of voice
Impression share is a good metric for what it measures. It answers one question well: of the auctions you were eligible for and chose to bid in, how often did you show? If that number is low, you have a budget or bid problem, and impression share will tell you so.
The trouble starts when teams treat it as a visibility metric. It isn’t. It’s an auction-participation metric. And it carries three blind spots that get expensive fast.
Blind spot one: the auctions you never entered. Impression share only counts eligible auctions. If a competitor is bidding on product queries you’ve never targeted, you don’t lose impression share. You simply don’t exist in that data. Your dashboard says 90 percent while a rival owns a whole category you can’t see. This is exactly what a competitive Google Shopping analysis of rival advertisers surfaces that the ads platform never will.
Blind spot two: organic Shopping listings. Google Shopping is no longer a paid-only surface. Organic product listings sit right alongside the ads, and they don’t appear in your paid impression share at all. A competitor can dominate the organic listings above your paid row, and your impression share won’t flinch. Share of voice counts both, which is why teams focused on tracking Google Shopping organic and paid listings on both surfaces catch gaps the ads platform hides.
Blind spot three: AI surfaces. AI Overviews and AI Mode now sit above the traditional Shopping block on a growing share of commercial queries. When an AI Overview cites three retailers and you’re not one of them, your paid impression share is untouched, but your real visibility just dropped. The metric can’t see the thing that’s actually eating your presence, which is why tracking AI Overviews on Shopping product searches now belongs in the same view as your paid data.
None of this makes impression share useless. It makes it partial. And senior buyers who’ve been burned by a “great” impression share number that didn’t move revenue already suspect as much.
See where your Shopping visibility is actually leaking
Run your Revenue Risk Report to see your Google Shopping share of voice against your competitors across paid, organic, and AI surfaces.
How accurate is Google’s Shopping impression share reporting?
Accurate for what it claims to measure, misleading for what teams assume it measures. Google’s impression share reporting is honest about auction participation. It was never built to describe your standing across the full Shopping results page, and it doesn’t pretend to. We’ve written before about why Google Shopping reports no longer explain performance on their own.
The pattern holds across competitive retail categories: the more contested the shelf, the wider the gap between what impression share reports and what share of voice actually measures. The clearest way to see that gap is to line up who wins each surface, which is exactly what our own panel data shows.
The takeaway holds without the exact number. If impression share is the only visibility metric in your Shopping review, you’re grading yourself on a test that skips the hardest questions.
Do paid and organic Google Shopping have the same winners?
No, and it isn’t close. We measured share of voice across paid Google Shopping and organic Merchant Listings for the same retail product queries over the same three months. The two surfaces are won by almost entirely different brands.
In GrowByData’s, from April to June 2026, the top five sellers in paid Google Shopping and the top five in organic Merchant Listings had no overlap. Wayfair led the paid shelf. Home Depot led the organic shelf at 8.6 percent share of voice, without ranking in the paid results at all.
Home Furnishings: paid vs organic Shopping share of voice
| Rank | Paid Google Shopping | Organic Merchant Listings |
|---|---|---|
| 1 | Wayfair 13.1% | Home Depot 26.1% |
| 2 | West Elm 7.8% | Ashley Furniture 8.0% |
| 3 | Pottery Barn 4.9% | Walmart 6.9% |
| 4 | Perigold 3.5% | IKEA 5.5% |
| 5 | AllModern 3.4% | Target 5.1% |
Zero overlap in the top five. The paid shelf belongs to furniture specialists. The organic shelf belongs to big-box and value retailers. Wayfair, the paid leader, sits sixth in organic.
Apparel: paid vs organic Shopping share of voice
| Rank | Paid Google Shopping | Organic Merchant Listings |
|---|---|---|
| 1 | Gap 7.3% | H&M 13.0% |
| 2 | Altar’d State 4.6% | Gap 8.6% |
| 3 | Quince 4.6% | Macy’s 7.6% |
| 4 | Children’s Place 2.8% | Abercrombie 7.2% |
| 5 | Shein 2.7% | Kohl’s 5.2% |
Only Gap appears on both shelves, and it leads paid while placing second in organic. Everything around it differs: direct-to-consumer and fast-fashion names win paid, department stores win organic.
Beauty and Personal Care: paid vs organic Shopping share of voice
| Rank | Paid Google Shopping | Organic Merchant Listings |
|---|---|---|
| 1 | Sephora 9.2% | Ulta 23.6% |
| 2 | CVS 3.8% | Target 16.8% |
| 3 | Quince 3.6% | Sephora 15.8% |
| 4 | Ulta 2.7% | Walmart 8.5% |
| 5 | NARS 2.1% | Walgreens 3.2% |
Sephora and Ulta appear on both shelves, but the picture inverts. Sephora leads paid at 9.2%, while Ulta owns the organic shelf at 23.6%, more than double any paid position. Mass retailers like Target and Walmart command the organic surface and barely register in paid.
Source: GrowByData SERP Tracking Data, April to June 2026. Paid Google Shopping compared with organic Merchant Listings share of voice.
Read the two columns side by side. The paid shelf belongs to furniture and direct-to-consumer specialists. The organic shelf belongs to big-box retailers. These are different companies competing for the same shoppers on the same page, and only one column shows up in your paid impression share.
So picture a home goods brand holding a strong impression share on its paid campaigns. The dashboard looks healthy. Meanwhile Home Depot, Target, and Walmart are taking the organic listings right above those ads, and none of it registers, because impression share was never built to count that surface. The paid winners and the organic winners are not the same brands, and no paid-only metric will ever tell you so.
How to measure Google Shopping share of voice
Measuring it properly means stepping outside the ads platform, because the ads platform can only report on its own auctions. A defensible share of voice measurement follows four steps.
- Define the competitive set. Pick the products, keywords, and competitor brands that actually matter to the category you’re defending. Share of voice is meaningless without a clear denominator.
- Capture the full results page. Track paid listings and organic Shopping listings together, in your chosen markets and devices, at a cadence that catches volatility rather than a monthly snapshot.
- Score presence, not just position. Count how many visible slots each brand holds across the tracked queries, then convert to a percentage. That’s the share of voice figure.
- Layer in the AI surfaces. Add AI Overview and AI Mode citations to the same view, so a drop in AI presence shows up as a visibility loss, not a blind spot.
Most teams don’t build this in-house. They lean on a platform for monitoring Google Shopping ads across their chosen markets and devices, so the presence score stays current without a standing manual effort. Do this consistently and you can watch your Shopping share of voice move week to week, tie it to specific competitors, and catch a category slip before it shows up as a revenue slip. Our 2026 analysis of Google Shopping visibility shows how far the gap can widen when only one surface is tracked.
What most retail teams get wrong
Picture a paid search director walking into a Monday review with an 85 percent impression share on their flagship category. On paper, the category is won. The slide is green. Everyone moves on.
Meanwhile a challenger brand owns the top organic Shopping listing on the same query, and an AI Overview above both rows recommends two competitors by name. The shopper sees the challenger first, the AI’s picks second, and the paid row third, if at all. That 85 percent describes an auction the director is winning. It says nothing about the shelf they’re losing. It’s the same mechanism behind why advertisers are losing Google Shopping visibility while their in-platform metrics still look healthy.
This is the gap. Point tools that report a single surface will always flatter the team that only looks at that surface. The reason to measure Google Shopping share of voice across paid, organic, and AI in one view isn’t tidiness. It’s that the shopper doesn’t experience your visibility one surface at a time, so measuring it that way hides exactly the losses that matter most.
Common questions about Google Shopping share of voice
Is Google Shopping share of voice the same as impression share?
No. Impression share measures how often you appeared in the auctions you entered. Share of voice measures your proportion of total visible presence across the Shopping results page, including organic listings and auctions you never entered.
Can you measure Shopping share of voice inside Google Ads?
Not fully. Google Ads reports on its own auctions, so it can’t see organic Shopping listings or AI surface presence. Measuring true share of voice requires tracking the full results page independently.
Why does Shopping share of voice matter for enterprise retailers?
Because at scale, the auctions you’re not entering and the surfaces you’re not tracking add up to real lost demand. Share of voice quantifies that gap so it can be defended in budget and strategy conversations.
Stop grading Shopping visibility on a partial metric
Get your Google Shopping share of voice scored against your competitors across paid, organic, and AI surfaces, so the next category review shows what shoppers actually see.