Key Takeaways
- Target’s paid Shopping Ads share fell 79% in Q2 while its organic share grew 53%, same category, same quarter.
- Apparel’s paid Shopping Ads leaderboard flipped entirely, from Shein to Gap, while organic barely moved.
- Paid and organic Shopping visibility often move in opposite directions, and a blended metric hides it.
- Automotive shows zero Shopping data this quarter. Cars aren’t sold through product listings.
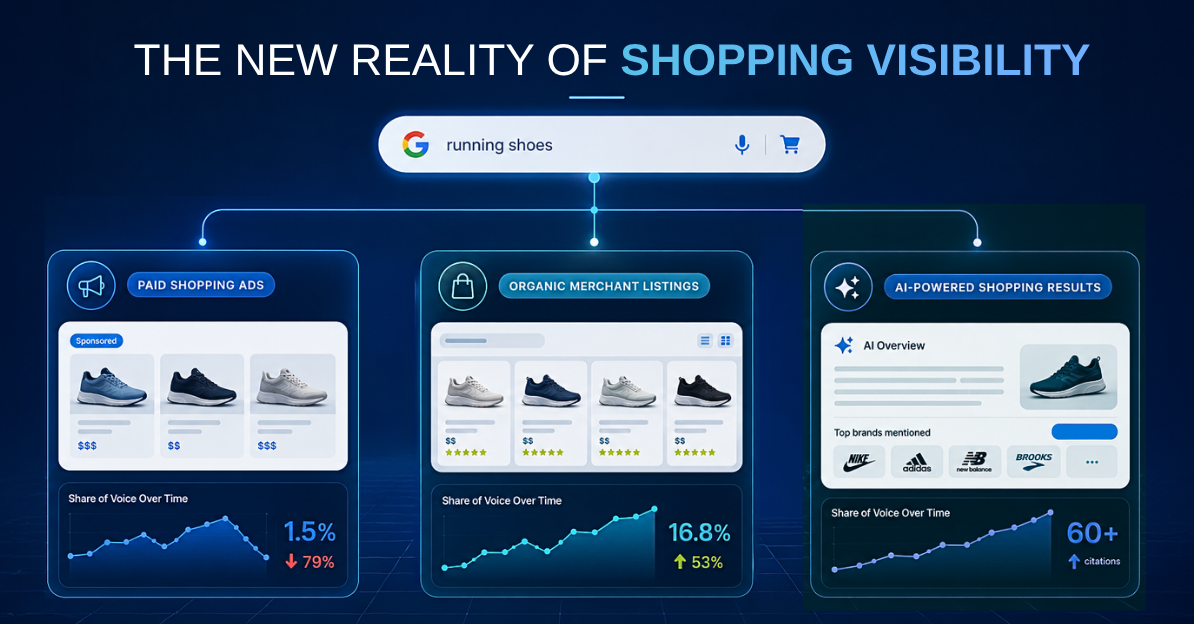
In Q2 2026, Target’s paid Shopping Ads share of voice in Beauty & Personal Care fell 79 percent, from 7.3% down to 1.5%. In the same quarter, on the same platform, in the same category, its organic Merchant Listings share grew 53 percent, climbing from 11.0% to 16.8% and passing Sephora for second place.
Same retailer. Same 90 days. Two opposite directions.
That split is the real story behind Google Shopping visibility right now, and most teams never see it, because most teams only watch one side of it.
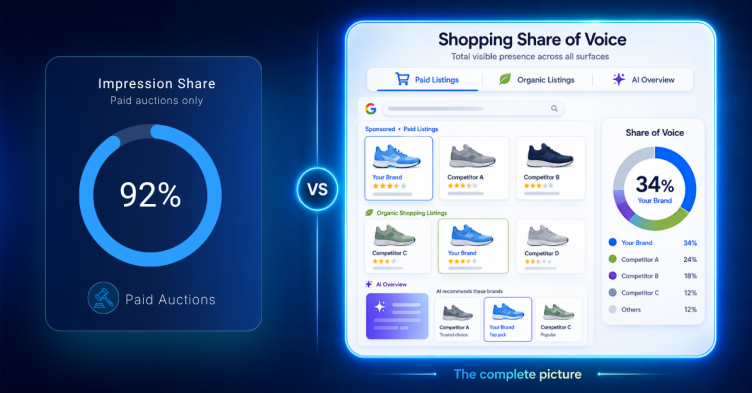
Google Shopping visibility covers two surfaces that Google ranks and reports on separately: paid Shopping Ads, the sponsored product listings at the top, and organic Merchant Listings, the unpaid product results beneath them. A brand’s position on one tells you almost nothing about its position on the other. This quarter’s data makes that hard to ignore.
This report comes from GrowByData: keyword-level tracking across
- Apparel,
- Beauty & Personal Care
- Automotive,
- & comparing Q2 2026 (April 1 to June 30) against Q1 2026 (January 1 to March 31).
Paid Shopping Ads and organic Merchant Listings are reported separately here, on purpose, because blending them is exactly the mistake this data argues against.
What Moved in Apparel Shopping Ads This Quarter
Paid Shopping Ads in Apparel had a genuine leadership change. That’s not a gradual slide. That’s a full reversal in one quarter.
| Seller | Paid Shopping Ads SOV, Q1 | Paid Shopping Ads SOV, Q2 | Change |
|---|---|---|---|
| Gap.com | 1.9% (#7) | 7.3% (#1) | Up, took the lead |
| Shein.com | 6.4% (#1) | 2.7% (#6) | Down, lost the lead |
| Quince.com | 3.7% | 4.6% | Up, steady |
Now look at the same category’s organic Merchant Listings over the identical window. The leaderboard barely moved.
| Seller | Organic Merchant Listings SOV, Q1 | Organic Merchant Listings SOV, Q2 | Change |
|---|---|---|---|
| H&M | 13.6% (#1) | 13.0% (#1) | Held rank |
| Gap.com | 8.7% (#2) | 8.6% (#2) | Held rank |
The organic leaderboard barely moved while the paid leaderboard changed hands entirely. That contrast is worth sitting with. Paid Shopping Ads monitoring has to be quarterly at minimum, because share of voice here is genuinely volatile. Organic Merchant Listings visibility moves on a slower clock. Track them as one blended number and you’re averaging two metrics that don’t move together, and the average won’t tell you what actually happened to either.
The Beauty Divergence: When Paid and Organic Visibility Split
Beauty & Personal Care is where this gets interesting.
In paid Shopping Ads, Target went from Q1’s clear leader to sixth place in Q2. Sephora, nowhere in the Q1 top ten, jumped straight to first. If that’s all you saw, the write-up is obvious: Target is losing to Sephora in Google Shopping. That’s the headline most visibility tools would generate. It would also be wrong.
| Metric | Target, Q1 | Target, Q2 | Sephora, Q1 | Sephora, Q2 |
|---|---|---|---|---|
| Paid Shopping Ads SOV | 7.3% (#1) | 1.5% (#6) | Not in top 10 | 9.2% (#1) |
| Organic Merchant Listings SOV | 11.0% (#3) | 16.8% (#2) | 16.5% (#2) | 15.8% (#3) |
Organic Merchant Listings tell a different story for the same brands, same category, same 90 days. Target’s organic share grew enough to pass Sephora for second place behind Ulta.
Target didn’t lose visibility in Beauty this quarter. It moved visibility from paid to organic, whether that was deliberate budget reallocation or a side effect of something else, and a report that only tracks paid Shopping Ads would have missed it completely.
That’s the actual risk in most Shopping visibility reporting. It measures the channel it’s built to measure and calls that channel the whole picture.
Want to know whether your own category’s visibility is shifting between paid and organic right now, not just whether the number went up or down? Get your Revenue Risk Report and see the split for your actual keyword set.
How Do Brands Appear in AI-Powered Shopping Search Results?
Shopping visibility isn’t staying inside Google’s Shopping tab either. Across AI search platforms, “how brands appear in AI-powered shopping search results” is now pulling real citation volume: over 60 citations on Google’s AI surfaces and over 50 on Bing’s in the most recent reporting window.
That’s a research-intent question, not a transactional one. Shoppers, and increasingly AI agents researching on shoppers’ behalf, are asking which brands show up when a category gets summarized instead of searched. Paid Shopping Ads placement has no direct bearing on that answer. Merchant Listings data feeds into it more, but not entirely, and not consistently across platforms.
Treating Google Shopping visibility, AI Overview visibility, and AI Mode citation as three separate problems, solved by three separate tools, is how most teams end up with three incomplete answers instead of one accurate picture. Competitor analysis for Google Shopping that stops at paid rank is already out of date.
Why Automotive Is Invisible in Shopping
One category in this panel produced no Shopping Ads or Merchant Listings data at all: Automotive.
That’s not a tracking gap. Cars aren’t sold through product listings, so there’s nothing for Google Shopping to surface. Automotive marketers compete almost entirely in text ads, local inventory ads, and organic search results instead, a completely different visibility problem with a completely different set of metrics.
Worth knowing before anyone builds a Shopping visibility strategy for a category that structurally can’t have one.
What This Means for Brands Tracking Visibility
Most Shopping visibility reporting treats share of voice as one number. This quarter says that model is wrong. Paid and organic Shopping surfaces move independently, sometimes in opposite directions for the same brand in the same category, and a single blended metric hides exactly the movement that matters.
Here’s the uncomfortable part. If your current reporting can’t tell you whether a Shopping visibility drop is a paid pullback, an organic decline, or both, you don’t actually know what happened in your category. You know what happened to a number.
Quarterly swings like Gap’s and Sephora’s don’t wait for an annual review to matter. By the time a static report catches up to them, the next quarter’s already moved again.
See it before your competitors do. Talk to an Expert and get a category breakdown that separates paid Shopping Ads from organic Merchant Listings, built from live Google Shopping Ads monitoring, not a single blended score.