There are hundreds of tools available to help marketers and advertisers gain insights into Google Search. However, not all insights are created equal. To maximize advertising ROI, marketers need to focus on uncommon, solid, and actionable insights. One key area where marketers can gain a competitive edge is by monitoring Amazon’s share of voice. Amazon is the largest advertiser on Google, and it competes in almost every category.
Share of Voice on Amazon refers to the visibility of any brand, keywords, or products on Amazon Marketplace. By tracking this metric, marketers can identify opportunities to improve their own visibility on Google.
GrowByData excels as a premier white-glove service provider for brands, retailers, and agencies, offering unparalleled data and insights to optimize marketing and advertising strategies, ensuring a competitive edge. A prime example of the advanced analytics we provide is the Amazon Share of Voice (SOV) on Google. Monitoring Amazon’s SOV fluctuations on Google search aids in making strategic marketing decisions.
In this analysis, we explore Amazon’s SOV in two categories – Apparel and accessories and Home Furnishing, uncovering valuable and intriguing insights from the data collected in 2022.
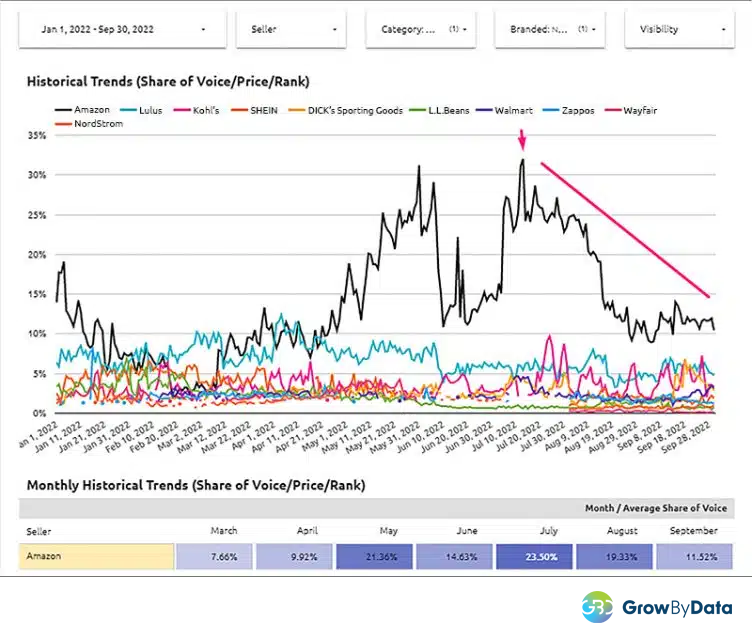
Apparels:
As shown in the trend graph below, Amazon’s share of voice (SOV) on Google began the year at 15% and then quickly declined to between 5% and 10% until May. However, there was a significant gain from May to mid-June, followed by another big jump in July (peaking at 31%) until mid-August. After that, Amazon’s SOV dropped off to more average levels.
These fluctuations suggest that Amazon significantly increases its advertising and marketing efforts before large shopping events, such as New Year’s Day, summer shopping, and the Fourth of July. We will continue to monitor the trend to see how it shifts during upcoming holidays, such as Halloween, Thanksgiving, and Christmas.
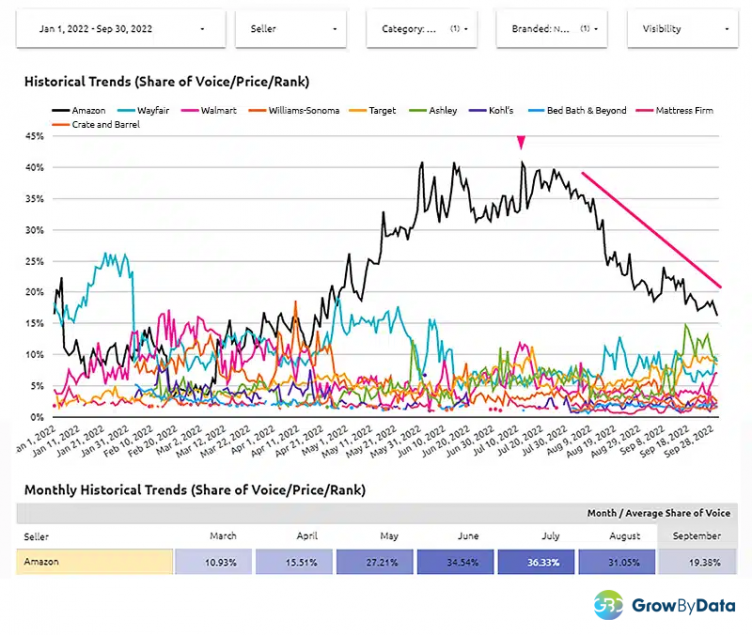
Home Furnishings:
The trend for Home Furnishing was similar to Amazon’s overall trend, with a sharp increase in SOV from May to mid-August. However, the difference was that the upward trend for Home Furnishing continued all the way to mid-August, before declining to more average levels.
This suggests that Amazon may have been targeting Home Furnishing specifically during this time period, perhaps due to an increase in demand for home goods during the summer months. We will continue to monitor the trend to see if it continues in the upcoming months.
Conclusion
Leveraging Amazon’s Share of Voice Industry Trend insights, marketers and advertisers can identify shifts in Amazon’s ad efforts. When the share of voice of Amazon is lower, it offers a chance to enhance advertising for a competitive edge.
Our capabilities extend beyond industry-wide analysis, providing detailed insights into geolocations, keywords, and devices, offering precise data on Amazon’s SOV trends.
The dynamic nature of online consumer shopping creates opportunities for marketers. Top brands, retailers, and agencies rely on our white-glove custom analytics to optimize Google performance and drive platform growth.