Say you’re the SEO Director at a mid-size apparel retailer. You’ve held positions 3 and 4 on your top commercial keywords for two quarters. Traffic should be stable. Instead it’s down 18% year over year.
You pull the rank tracker. Everything looks fine. You check for algorithm updates. Nothing obvious. You sit in the weekly review and everyone stares at the same data, and nobody has a convincing answer.
Here’s what the rank tracker isn’t telling you. Above your position 3, there’s an AI Overview citing two competitors. A People Also Ask box that fires on 60% of your commercial keywords. You don’t appear in a single one. A Merchant Listings carousel where Walmart, Target, and a DTC brand you’ve never heard of are splitting the clicks before your organic result even registers on screen.
Your rank didn’t drop. The page got more crowded around you. And the tools most teams rely on weren’t built to show that. There’s a reason rank tracking and SERP monitoring are different disciplines and confusing the two is exactly how this traffic loss goes undiagnosed for quarters.
That’s what SERP feature opportunity analysis is for. This guide walks through how to do it, step by step, with real data, using GBD Compass.
We’ll use the apparel retailer scenario throughout to make each step concrete.
SERP feature types tracked daily in GBD Compass across every keyword and market
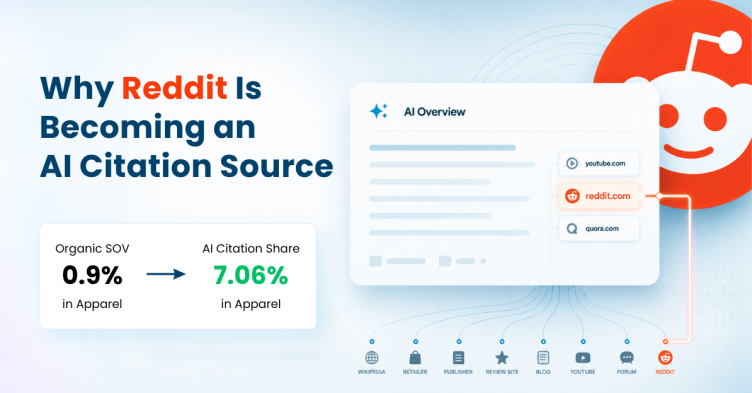
Average AI Overview presence across tracked US retail queries, Jan–May 2026 (GBD data)
Standard rank trackers that show competitor feature ownership on your terms
What is a SERP feature opportunity?
A SERP feature opportunity is a result type that fires on a keyword you care about, where your brand has no presence, or where a competitor has meaningfully more presence than you do.
It’s different from a keyword gap. A keyword gap is a term you don’t rank for at all. A SERP feature gap is a position on a page you already rank on. You can hold position 1 organically and still be losing to a competitor who owns the AI Overview, the PAA box, and the Merchant Listing above you.
Same keyword. Same organic rank. Completely different click share.
For our apparel retailer: they rank position 3 for “women’s winter coats.” But on that SERP, AI Overview fires and cites two fast-fashion competitors. PAA shows five questions, none answered by the retailer. A Merchant Listings carousel shows six products, zero from their feed. Their organic result is on the page. It’s just getting a fraction of what it should.
Step 1: Map which features are actually firing on your keywords
Before you can find gaps, you need to know what’s on the page. Not what you assume is there. What’s actually firing on your tracked keyword set, right now.
This matters more than most teams realise. You might assume AI Overview is your biggest gap. But if it only fires on 12% of your commercial terms and sits below the fold most of the time, it’s not your biggest problem. The feature that fires on 60% of your terms and consistently lands above the fold is. You won’t know which one that is until you look at the data.
Open GBD Compass and go to Search → SERP Overview → SERP Summary.
The first thing you’ll see is the SERP Feature Presence Breakdown (ATF/BTF) chart. It shows every feature type across your keyword set: PAA, AI Overview, Merchant Listings, Videos, Images, Featured Snippet, Things to Know, Discussion and Forums, Maps, Text Ads, Shopping, What People Are Saying, and more. Each feature’s bar is split by above-the-fold (lime) and below-the-fold (teal). A presence line runs across the top.
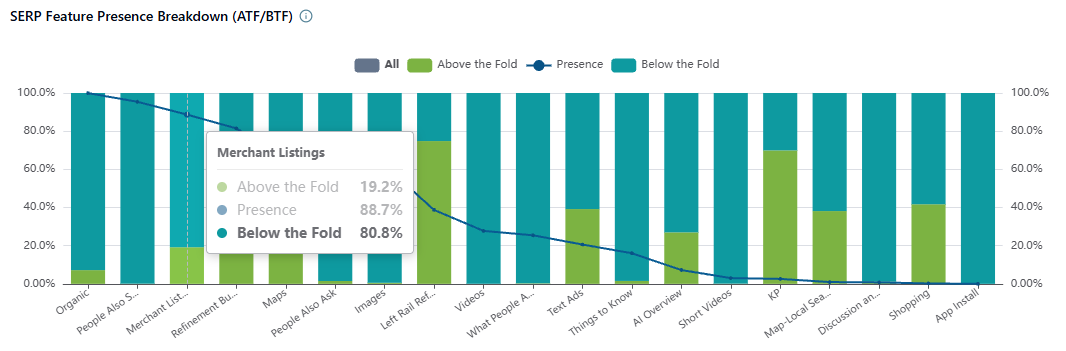
GBD Compass: SERP Feature Presence Breakdown (ATF/BTF). The lime portion of each bar is above the fold. The Monthly SOV Trends table at the bottom shows how each feature’s share has shifted month to month across the tracked period.
For our apparel retailer, this view shows PAA firing on 58% of their tracked keywords with a strong above-the-fold rate. AI Overview fires on 61%, the highest of any non-ad feature, and almost entirely above the fold. Merchant Listings fire on 44%. Organic is there, but it’s competing with three or four features sitting above it on most of their high-intent terms.
Scroll down the same page to the Monthly SOV Trends by SERP Feature table. This shows how each feature’s presence has shifted month to month. In our example, AI Overview went from 20.5% in February to 24.8% in April. Growing footprint, growing gap. If you’re not in it and it’s expanding, the cost of that absence is compounding.
From this step, you want to leave with a short list: the features that fire on more than 25% of your tracked keywords and carry a strong above-the-fold rate. Those are your candidates. For our retailer, that’s AI Overview, PAA, and Merchant Listings.
Step 2: Find where your brand has zero presence
You now know which features matter. The next question is harder: which of those features does your brand not appear in at all?
Not low SOV. Zero. Every click that feature generates goes to someone else.
This is where most gap analyses fall short. Teams look at overall share of voice and see a number (say, 3.2%) and assume they’re in the game. But overall SOV is an average across all features. A brand can have decent organic SOV and zero presence in AI Overview, PAA, and Merchant Listings. The 3.2% is hiding the real picture.
Go to Search → Share of Voice Analysis → Competitive Share of Voice.
Don’t start with the overall Holistic SOV leaderboard. Scroll past it to the Leaders by SERP Feature panel. This shows six separate leaderboards, one each for AIO, Organic, Merchant Listings, People Also Ask, What People Are Saying, and Videos, each ranked by SOV% for that specific feature on your keyword set.
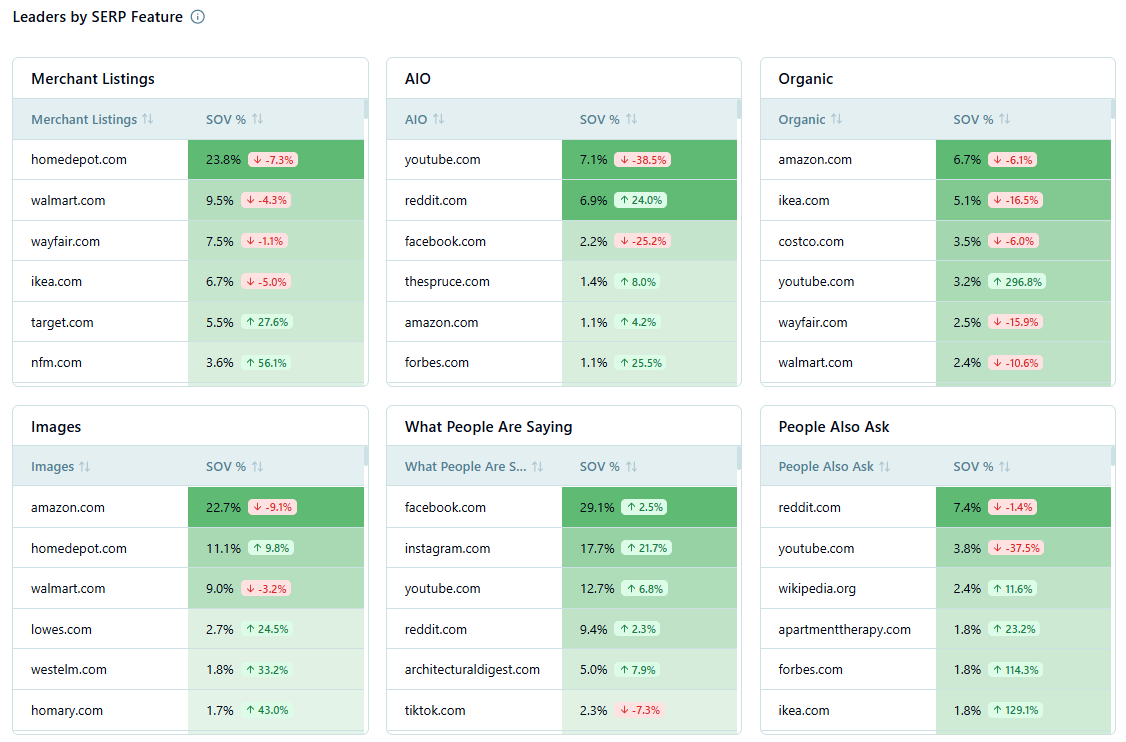
GBD Compass: Competitive Share of Voice. The Leaders by SERP Feature panel (middle section) shows separate SOV leaderboards for each feature type. If your domain doesn’t appear in a leaderboard, you have zero meaningful presence in that feature across your keyword set. The Competitive Tactics chart (bottom) shows each domain’s feature mix.
If your brand doesn’t appear in one of those leaderboards, you have zero meaningful presence in that feature across your tracked keywords.
For our apparel retailer: they appear in the Organic leaderboard at position 6. They don’t appear in the AIO leaderboard, the PAA leaderboard, or the Merchant Listings leaderboard. Three features that fire on a combined 160%+ presence rate across their keywords. They’re in none of them.
Match this against your candidate list from Step 1. Any feature with 25%+ presence where you don’t appear in the leaderboard is a confirmed gap. Write those down. That’s your working gap list.
Also look at the Competitive Tactics chart at the bottom of this view. It shows each domain’s feature mix as a horizontal stacked bar. A competitor with a heavy AI Overview bar next to a brand with almost no AIO presence is the visual version of the gap, useful to show in a strategy presentation without needing to explain the numbers.
Step 3: See who owns the features you’re missing
There’s a difference between “no one strong owns this feature on my keywords” and “a direct competitor owns it.” The second situation is the one worth prioritising.
If no strong incumbent holds a feature, that’s a greenfield opportunity, harder to frame as urgent, easier to delay. If a direct competitor holds it and has been growing share month over month, that’s a competitive pressure problem with a business impact you can calculate. Much easier to get buy-in for.
Stay in the Competitive Share of Voice view. Look at the feature leaderboards from Step 2, the ones where your brand doesn’t appear. Who does appear? Note their SOV% for that specific feature.
For our apparel retailer: in the PAA leaderboard, a competitor holds 6.3% SOV across the keyword set. Another holds 3.9%. In the AI Overview leaderboard, a fast-fashion brand holds 11.9%, the highest of any domain in the set. In Merchant Listings, Walmart leads at 10.3%, followed by Target at 5.9% and a DTC brand at 3.2%.
Now look at the Competitive Tactics chart for those same domains. The fast-fashion competitor has a large AI Overview bar, a notable PAA bar, and a Merchant Listings bar. They’re capturing intent at three separate points on the same page the retailer is ranking organically. That’s not one gap. That’s a three-surface deficit on their own keywords.
That’s what the rank tracker misses. The question isn’t “did my rank drop?” It’s “is my competitor’s feature footprint expanding above me?” Those are different problems with different solutions. For Shopping and Merchant Listings specifically, Google Shopping competitor analysis gives you the full method for tracking PLA share of voice and pricing signals alongside feature presence.
Step 4: Understand what winning each feature actually requires
You have a confirmed gap list. Now the question is: what does closing each gap actually involve? This is where most gap analyses end, with a list of things you’re missing but no diagnosis of why you’re missing them.
Each feature type has a different competitive dynamic. PAA gaps are usually a content structure problem. Merchant Listings gaps are usually a feed and pricing problem. AI Overview gaps are usually an authority and off-page signal problem. You can’t treat them the same way, and you shouldn’t try.
GBD Compass has a dedicated sub-report for each feature type under Search → SEO Insights. Each one tells you not just that the gap exists, but what’s winning that feature on your keywords, so you can build the right fix, not just any fix.
If your gap is People Also Ask
The PAA box fires on a significant share of commercial queries. For our apparel retailer, it fires on 58% of their tracked terms. They appear in zero of those boxes. But before writing new content, the question is: which questions are actually firing, and who’s answering them?
Go to Search → SEO Insights → PAA Insights.
The table lists every PAA question firing on your tracked keywords: the domain currently answering it, the URL, average rank, how many of your keywords trigger it, and the above-the-fold rate. Sort by the keyword count column. The questions that trigger across the most keywords are your highest-leverage targets.
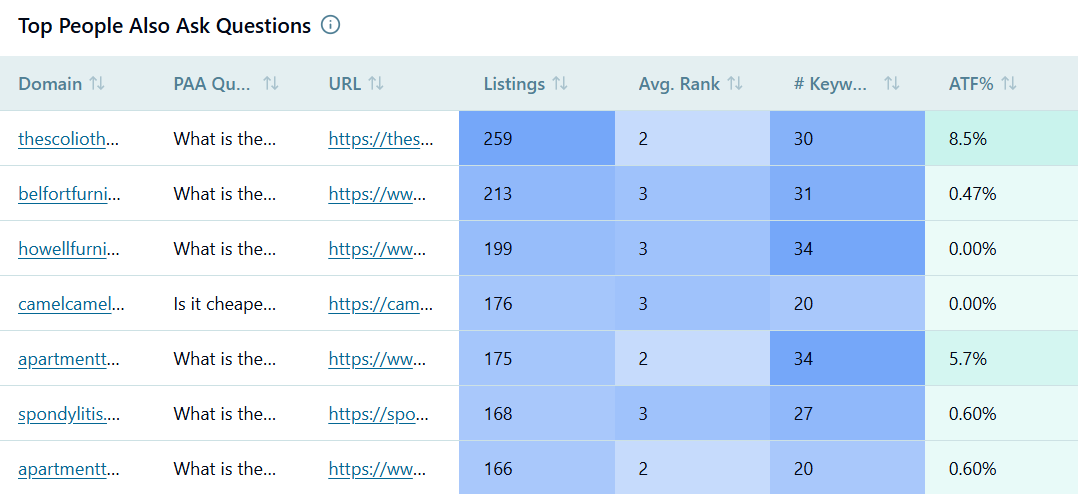
GBD Compass: PAA Insights. Sort by keyword count to find the questions appearing most frequently across your tracked terms. These are the questions your content needs to answer, specifically in the format Google extracts for PAA boxes.
For our apparel retailer, this surfaces questions like “What’s the warmest women’s winter coat for everyday wear?” and “How do I choose a coat size?” firing across 40+ of their tracked keywords. A competitor is answering both, with short, directly structured Q&A sections that Google is pulling verbatim into the box.
That’s the gap and the fix in the same view. Add those questions to existing product category pages and collection guides, with direct answers in the first two sentences of each answer block. No new URLs needed in most cases.
If your gap is Merchant Listings
Merchant Listings are the organic product carousel, separate from Shopping Ads, and won through product feed quality, not content optimisation. If your brand is absent here, the fix isn’t an editorial task. It’s a merchandising and data feed task. If you’re also running Shopping Ads on the same keywords, it’s worth understanding how organic and paid Shopping surfaces interact before deciding where to prioritise effort.
Go to Search → SEO Insights → Merchant Listings.
The report shows the top sellers on your tracked keywords by SOV%, along with their average price, discount percentage, free shipping rate, average rating, review count, and listing volume. That last column is where the diagnosis usually starts.

GBD Compass: Merchant Listings. The listings count column tells you the scale of each seller’s feed. The discount and free shipping columns tell you what’s winning the carousel beyond product quality. Historical trend shows momentum.
For our apparel retailer, Walmart has 1.2 million listings. Their own Google Merchant Center feed has 8,400 products submitted. Feed coverage is the primary gap. Not content, not pricing. The discount and free shipping columns confirm that the DTC competitor winning 3.2% SOV is offering 29% average discounts and free shipping on 69% of their listings. The retailer offers neither.
Two separate problems visible from one report. Feed volume and promotional signal. Both are fixable. They’re different conversations, with different teams, requiring different timelines. For a deeper look at tracking Shopping Ads activity alongside Merchant Listings presence, see How to Monitor Google Shopping Ads.
Step 5: Check whether gaps vary by region or category
Before you take this list to your team, check one more thing. A gap that looks uniform nationally often isn’t.
A competitor might own the AI Overview in New York and Chicago but have weak presence in Phoenix and Seattle on the same queries. A Merchant Listings gap might be concentrated in outerwear, where your feed is thin, while you’re competitive in footwear. Committing resource to a national fix before knowing whether the gap is concentrated or diffuse is the kind of thing that makes quarterly reviews awkward.
Go to Search → Share of Voice Analysis → Regional Insights and Category Insights.
Both tabs have a SERP Feature filter. Apply it for the specific feature you’re investigating before you read anything else. Overall SOV by region looks very different from PAA SOV by region. You want the second one.
For our apparel retailer: the PAA gap is sharpest in New York and LA, their two highest-revenue markets. The Merchant Listings gap is almost entirely concentrated in outerwear and activewear categories. That changes the prioritisation. Fix PAA in NY and LA first: high revenue impact, relatively contained content task. Fix the outerwear feed second: one category audit rather than a full feed rebuild.
How to prioritise the gaps you’ve found
You’ve now got a confirmed gap list with regional and category context. Here’s a simple way to decide what to work on first.
Three factors determine priority: how often the feature fires on your keywords, how much of it sits above the fold, and how strong the competitor holding it already is. High presence, high ATF rate, strong incumbent: that’s your top priority. Low presence, mostly below the fold, no clear competitor leader: that’s the bottom of the list.
| Feature gap | Paid PLAs | Organic Listings |
|---|---|---|
| AI Overview Citations: competitor cited, you’re not | Google Ads (Auction Insights, campaign reports) | Content depth and off-page authority. Build topical coverage and earn third-party citations from sources AI engines trust for your category. |
| People Also Ask: competitor answers questions you don’t | High | Content restructure. Use PAA Insights to pull the exact questions firing on your terms and add direct Q&A blocks targeting each one to existing pages |
| Merchant Listings: competitor present, you’re absent | High | Feed and pricing. Check listing volume, discount rate, and free shipping coverage in the Merchant Listings report versus category leaders. |
| Video results: competitor’s YouTube content ranks above your organic | High | Feed and pricing. Check listing volume, discount rate, and free shipping coverage in the Merchant Listings report versus category leaders. |
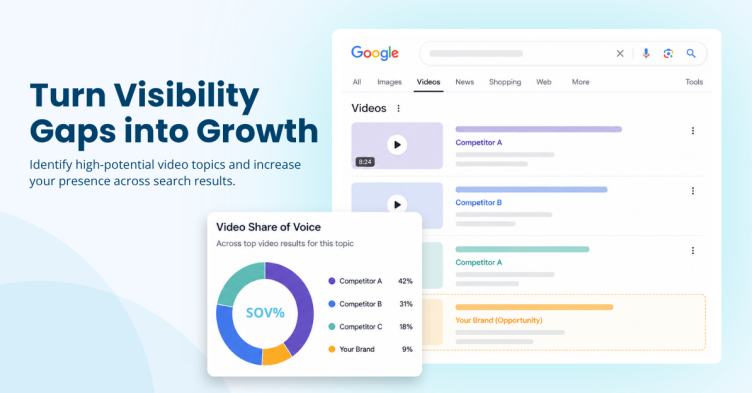
| Update frequency | Medium | Video content. Use Video Insights to identify which keywords and publisher types are winning video results on your terms, and build to that pattern. |
One principle applies to all of them. Start with the gap where the feature fires most, sits highest on the page, and has the clearest competitor presence. That’s where closing the gap has the biggest revenue impact.
And once you’ve identified your gaps, the next job is making sure you know immediately when a competitor enters a feature you hold, or a new feature starts expanding on your terms. That’s a monitoring problem, not an analysis problem. Covered in How to Track SERP Features.
The analysis tells you where you are. The monitoring tells you when things change.
Frequently asked questions
What’s the difference between a SERP feature opportunity and a keyword gap?
A keyword gap is a term you don’t rank for. A SERP feature opportunity is a result type you don’t appear in, on terms you already rank for. A brand can hold position 1 organically and have a major SERP feature gap if a competitor owns the AI Overview, PAA box, and Merchant Listing above them on the same query. The rank is identical. The visibility isn’t.
Which SERP features should I prioritise first?
Start with the features that fire most frequently on your commercial keywords and sit above the fold. For most retail and ecommerce brands, that’s AI Overviews, People Also Ask, and Merchant Listings. The exact priority depends on your keyword set. Check the SERP Feature Presence Breakdown in GBD Compass before assuming which features matter for your terms.
How do I find SERP feature opportunities without a dedicated tool?
Start manually: search your top 20 commercial keywords and note which features appear above your organic listing and whether your brand appears in them. You’ll get a rough picture quickly. Scaling this across a full keyword set with competitive SOV data, daily tracking, and feature-level breakdowns requires a purpose-built tool like GBD Compass.
How often should I run a SERP feature gap analysis?
Monthly is the right cadence for a full gap review on commercial keyword sets. Features shift with algorithm updates, competitor moves, and seasonal changes. A gap that didn’t exist in January can be significant by April. Daily tracking in Compass catches sudden moves between scheduled reviews, so you’re not finding out about a competitive change two months after it happened.
Can SERP feature gaps look different by region or category?
Yes, often significantly. A national gap analysis can hide regional variation. A competitor may lead AI Overview in your top metro and be absent in others. The same gap can have different underlying causes in different product categories. Always check Regional Insights and Category Insights with the SERP Feature filter applied before deciding on a fix.