
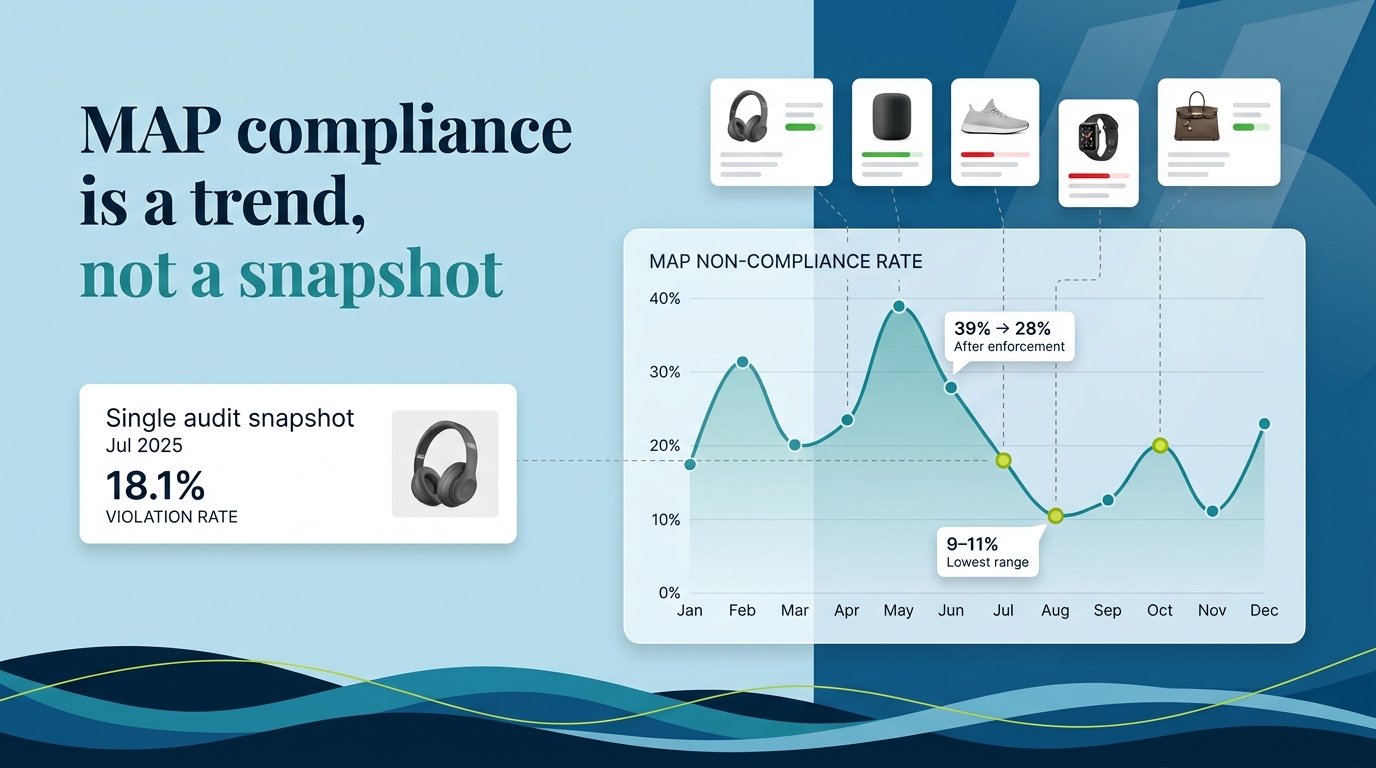
A MAP audit tells you how many sellers were below MAP when it ran. It can’t tell you whether that number is normal for your brand, getting better, or about to spike next month. Compliance behaves like a trend, and a trend needs more than one reading.
GrowByData monitoring data for six brands, June 2025 to June 2026, shows how much a single reading can mislead. In 17 of 55 month-to-month comparisons, a brand’s violation rate moved by at least 3 percentage points. Where another consecutive month was available, nearly half of those moves reversed direction the following month.
- 2.8% to 19.7%. One clothing brand’s violation rate, August to September 2025. Both readings were accurate, and neither showed the brand’s 8.1% average for the period.
- 53% to 62% for eight months, then a sustained decline. Another clothing brand moved within that band until February 2026, then fell to 40.7% by June.
- 30%, then about 5%. Flagged violations on consecutive days right after a MAP suspension ended.
- Source: GrowByData MAP monitoring data for six anonymized brands in five categories: clothing (two brands), musical accessories, stationery, pet supplies and garden machinery.
- Unit: one violation is one product listed below MAP by one seller on one day. Monthly rates are violations divided by all seller and product checks: 9,415,477 checks, 2,164,326 of them below MAP.
- Period: June 2025 to June 2026. Pet supplies from October 2025, garden machinery September 2025 to February 2026, musical accessories November 2025 to May 2026. Months with under 1,000 checks are excluded, and month-to-month comparisons use unrounded rates.
- Daily figures: the suspension and new-violator examples come from daily monitoring of individual brands, separate from the monthly dataset.
- Limits: each category is one brand’s experience, not an industry benchmark. Our Google Shopping MAP violations study uses a different period and unit, so its rates aren’t directly comparable.
The snapshot problem: one brand, 2.8% in August and 19.7% in September
Audit each of these brands in a single month and the result depends heavily on which month you pick. The chart shows every result a one-month audit could have returned over the period. 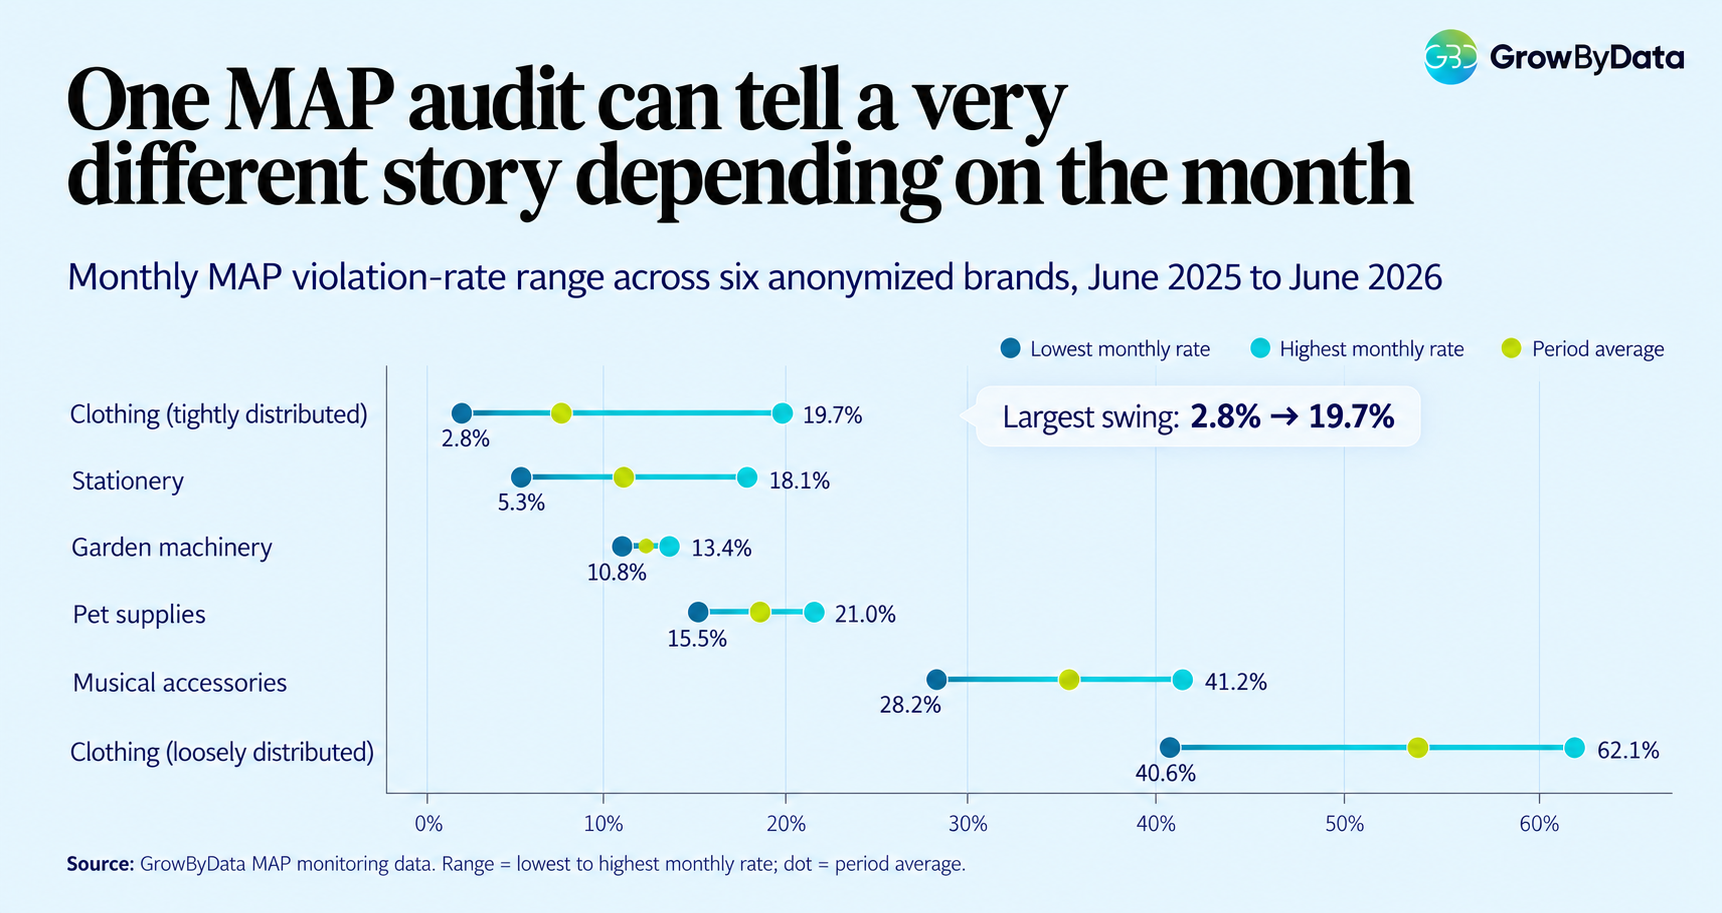
The tightly distributed clothing brand is the clearest case. An August 2025 audit would have called it clean at 2.8%. A September audit, one month later, would have flagged 19.7%. Neither matched the brand’s 8.1% average.
The stationery brand jumped from 5.3% in June 2025 to 18.1% in July, and from 8.8% to 28.9% on Google Shopping alone. Over the full period, its monthly rate changed direction 8 times.
Narrow ranges exist too. Garden machinery stayed between 10.8% and 13.4%. But you only learn a brand’s range is narrow by measuring it more than once.
Direction: two audits can point the wrong way
A second audit helps, but two readings still may not establish a trend.
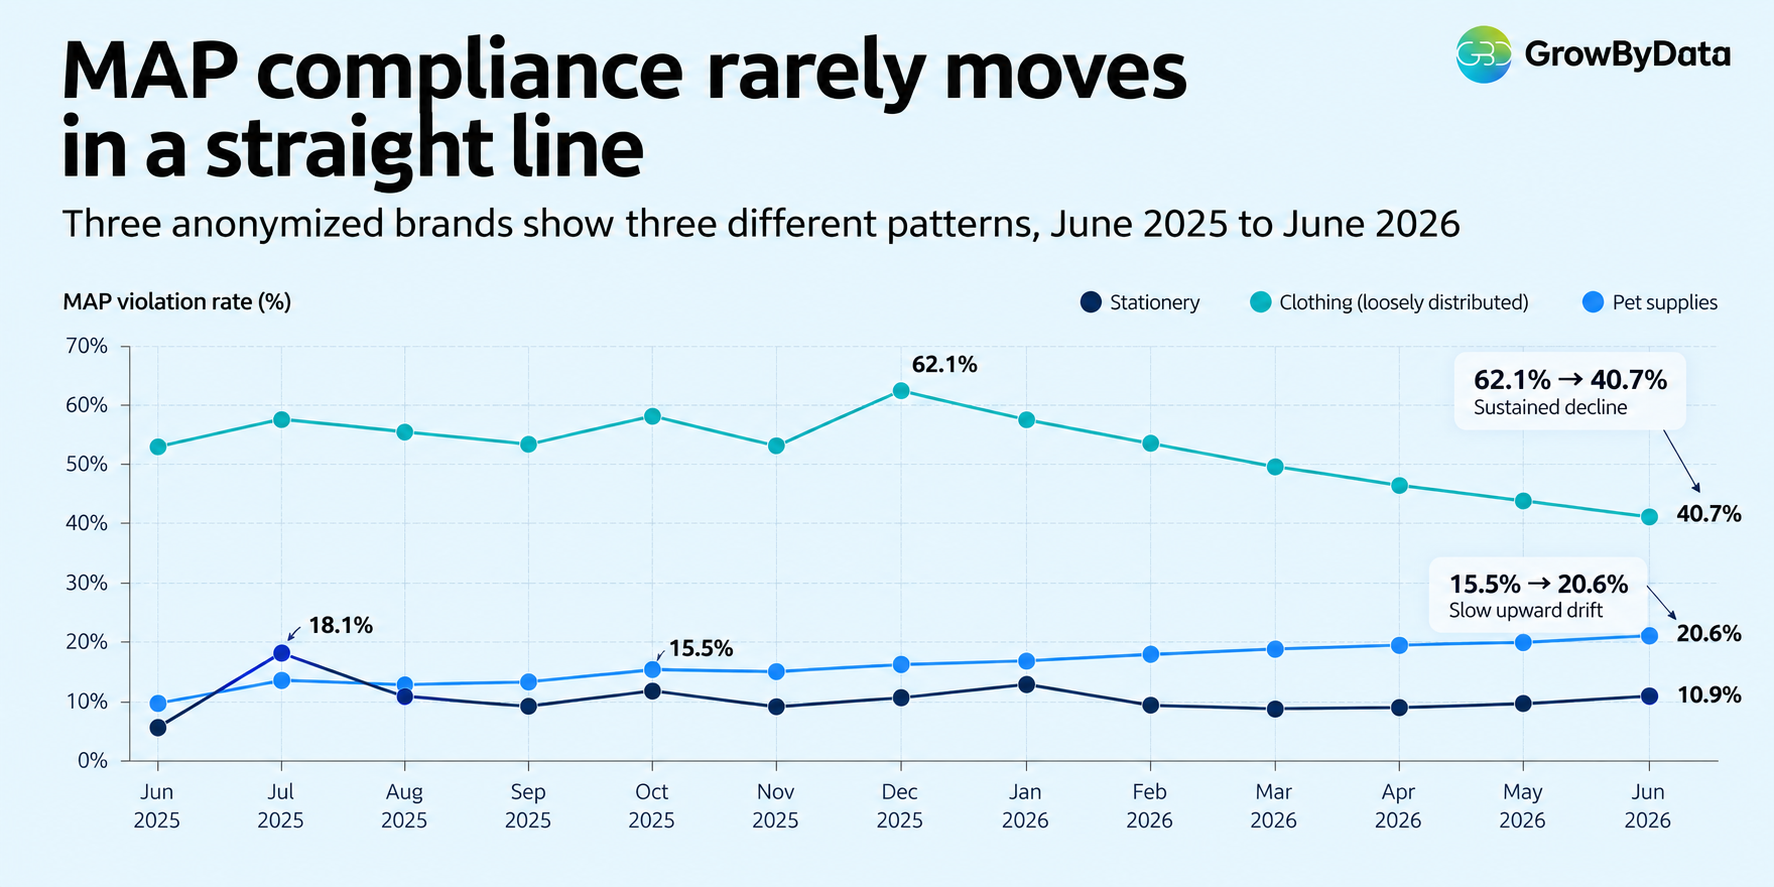
Audit the loosely distributed clothing brand in November 2025 (52.9%) and again in December (62.1%), and you’d conclude compliance was slipping. The brand then fell every month from February to May 2026 and finished June at 40.7%.
Stationery took seven months to come down from its 18.1% peak and has held between 8.7% and 10.9% since February 2026. Pet supplies went the other way, from 15.5% to 20.6%, in steps small enough that no single reading looked alarming.
Day-level swings: 30% one day, about 5% the next
Daily data swings harder still. One clothing brand ran a week-long MAP suspension from February 11 to 17. The day after it closed, 30% of listings were still flagged below MAP. A day later the rate was about 5%. A second window, May 20 to 26, did the same: 25% on day one, about 7% on day two, then 19% again on June 2.
A spot check on May 28 and one on June 2 would both be right about that day and wrong about the brand. For planning the window itself, see our guide to managing MAP pricing during MAP holidays.
The seller list: 8 to 38 new violators a month after the first audit
An audit’s seller list starts aging the day it’s delivered. In one brand’s monitoring, the first month surfaced 90 first-time violators. The next five months brought 8, 38, 10, 21 and 26 more, with no downward trend.
Across six brands in our Google Shopping MAP violations study, first-time violators averaged about 71 a month. Enforcement that works from a fixed list is chasing last quarter’s sellers while new ones set this quarter’s prices.
What a one-time audit is good for, and where it stops
An audit is the right first step. It just isn’t a compliance program.
| A one-time audit gives you | Ongoing monitoring can show you |
|---|---|
| A baseline violation rate by channel | Whether that rate is your normal level or a bad month |
| The sellers carrying your products today | The sellers who start carrying them next month |
| A first pass at authorized and unauthorized sellers | Which sellers repeat after they’ve been notified |
| A starting point | Evidence of how seller behavior changed after enforcement |
The last row is the one leadership asks about. You can’t judge whether a notice program worked from a single reading. You need the line before and after.
Know your baseline before you judge the trend. Request a MAP compliance audit to see your violation rate by channel, then track it month by month.
Running MAP compliance as a trend: four numbers to review every month
- Violation rate by brand and channel, with a three-month average beside it. Almost a third of monthly moves in this data were 3 points or more, and nearly half of those reversed. Judge direction on the average, and look into any single-month move of 5 points or more (10 of 55 comparisons).
- New violators. Count them separately from known offenders. They won’t show up in a review of last month’s list.
- Repeat offenders and notice outcomes. In our Google Shopping study, reseller and brand pairs that violated in six or more months drove 94% of violations. Track what share of notified sellers are compliant 30 days later.
- The 48 hours after every promotion or suspension. Watch the snapback, and check again a week later.
How often to check each seller should follow seller risk, not a fixed calendar. Our guide on why MAP violations keep coming back covers how to set that up.
Frequently asked questions
Is a one-time MAP audit worth doing?
Yes, as a baseline. It tells you where you stand today, who sells your products and which channels need attention first. It can’t tell you whether today is typical, so measure against it every month after.
How long before MAP monitoring shows results?
Monitoring starts producing data immediately, but establishing a reliable compliance trend usually takes several months. In this data, the stationery brand took seven months to go from 18.1% to under 10%.
Can MAP compliance get worse even with monitoring in place?
Yes. The pet supplies brand rose from 15.5% to about 21% between October 2025 and June 2026, and no single month moved by more than 3 points. That slow drift is what a periodic audit misses, because each reading looks close to the last.
Start with a baseline, then watch the line
If your last MAP review was a one-off, you know one point on the line. Talk to a GrowByData expert to book a demo, or request a MAP compliance audit to set your baseline.
Sources
- GrowByData MAP monitoring data, six brands in five categories, June 2025 to June 2026.
- Google Shopping MAP violations: 617,958 reseller-SKU observations, GrowByData, September 23, 2026.