
Minimum advertised price (MAP) policies keep advertised prices consistent and protect the retailers that follow them. Enforcing one is harder, because it depends on seeing every place your products are advertised and knowing which sellers break the policy again and again. The FTC’s guidance on manufacturer-imposed requirements sets out where those policies can and cannot go.
Most MAP programs start with the channels a brand already knows: authorized retailers and the major marketplaces. Those channels matter, but they aren’t the whole reseller picture.
GrowByData analyzed 617,958 reseller-SKU observations collected between January 2024 and August 2026 across six consumer brands.
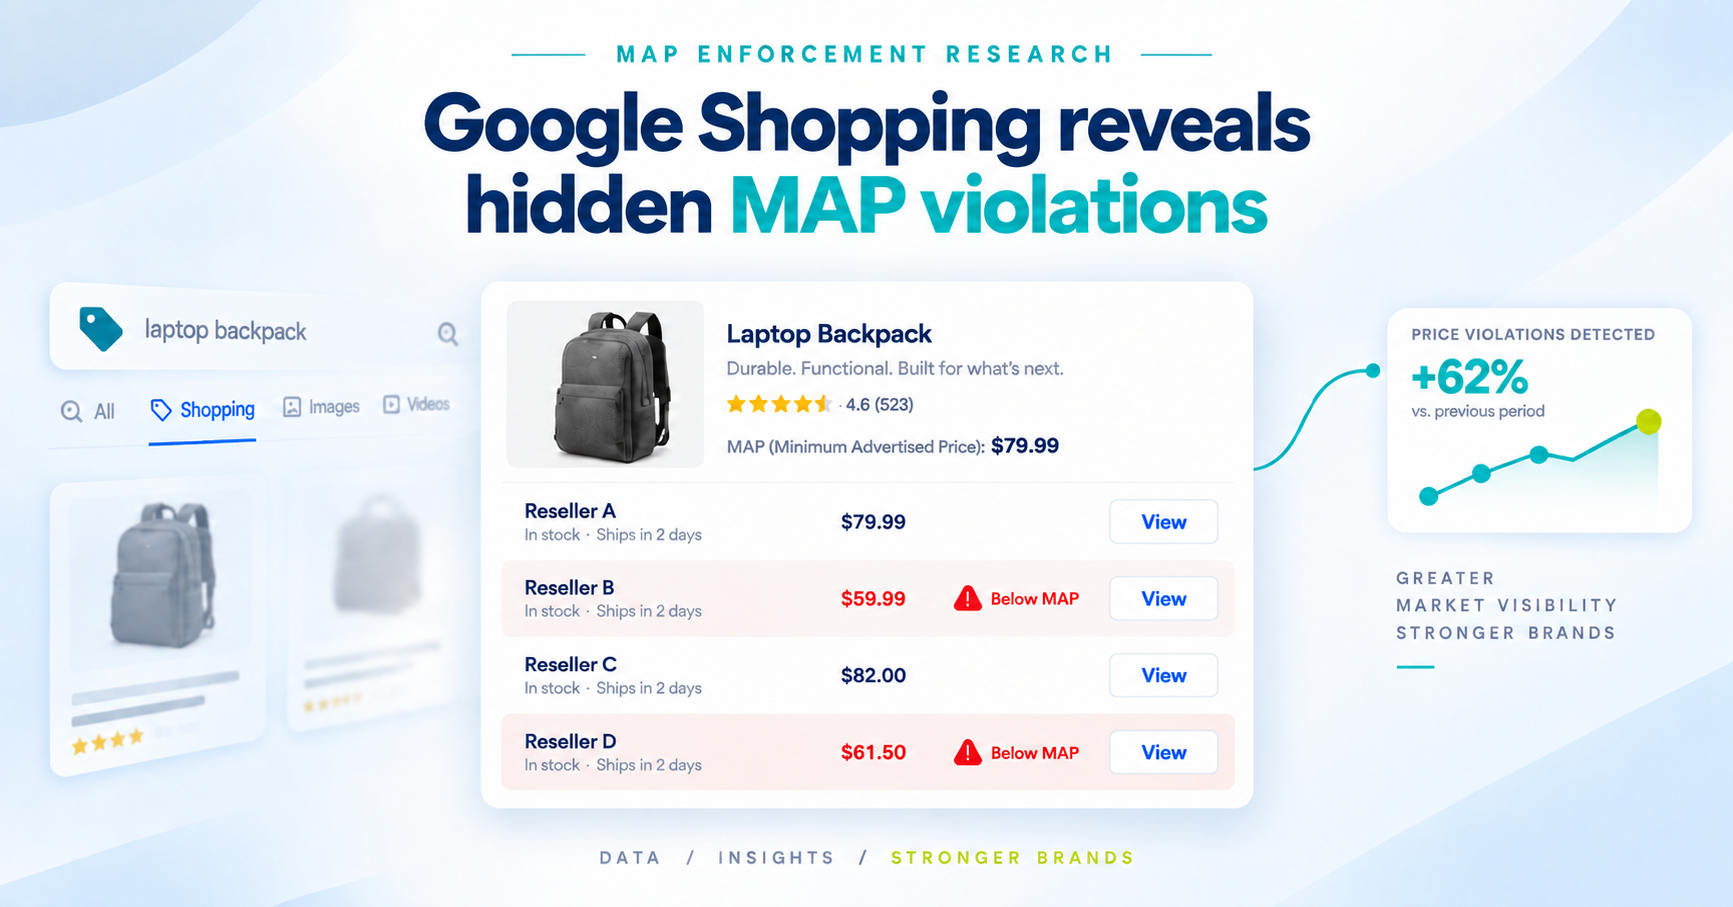
The analysis found that Google Shopping accounted for 80% of recorded MAP violations and surfaced thousands of resellers that marketplace monitoring never identified under the same name.
This article examines:
- Where MAP violations appear across shopping channels
- Why marketplace-only monitoring can leave reseller visibility gaps
- How repeat offenders account for the majority of violations
- How brands can prioritize MAP enforcement efforts
The Numbers: 617,958 Reseller-SKU Observations Across Six Brands
The analysis covered MAP monitoring data for six consumer brands in stationery, tactical gear, apparel, pet supplies, outdoor power equipment and general consumer products.
Key Findings
- 80% of recorded MAP violations appeared on Google Shopping.
- 98% of violating Google Shopping reseller names were not identified under the same name in marketplace monitoring.
- 86% of violations came from the top 10% of violating reseller-brand combinations.
- 854 reseller-brand combinations were below MAP on every observed check.
- 61% of Google Shopping reseller names were classified as marketplace storefronts.
Where MAP Violations Happen
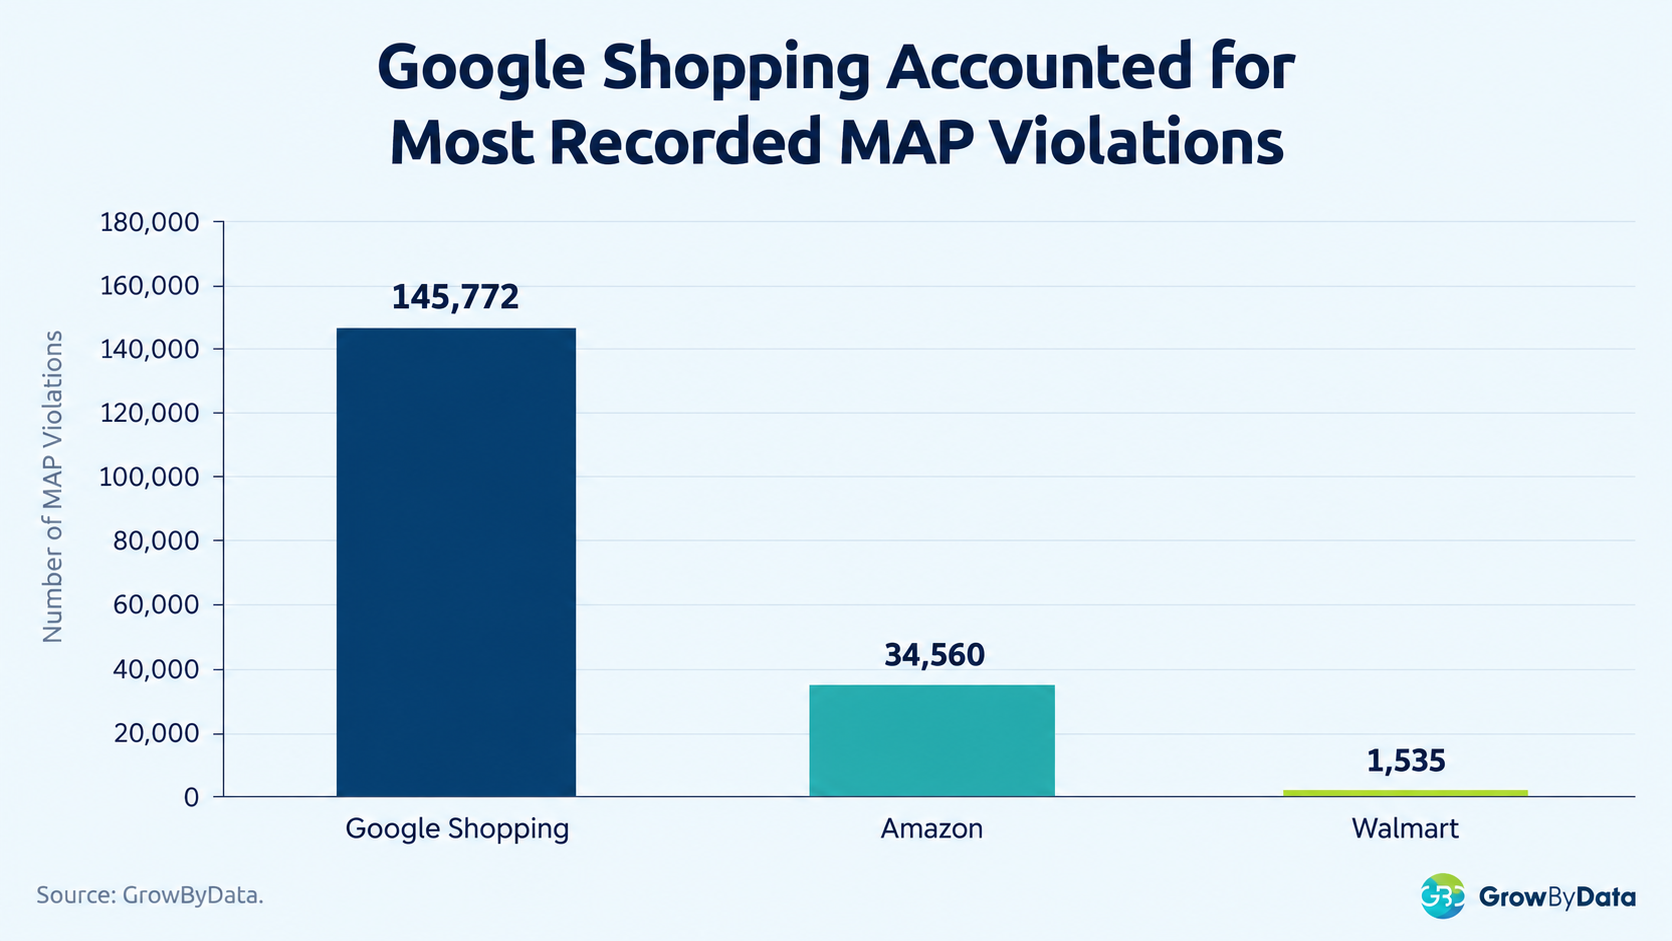
Brands often begin MAP monitoring with the channels they manage directly: Amazon, Walmart and authorized retailer websites. In this dataset, Google Shopping showed a much broader group of sellers, and it recorded both the largest number of violations and the highest number of distinct reseller names.
| Channel | Reseller-SKU Observations | MAP Violations | Violation Rate | Distinct Resellers |
|---|---|---|---|---|
| Google Shopping | 437,488 | 145,772 | 33.3% | 4,054 |
| Amazon | 165,070 | 34,560 | 20.9% | 423 |
| Walmart | 15,400 | 1,535 | 10.0% | 42 |
Note: Channel coverage varied by brand. Google Shopping monitoring included all six brands, while Amazon and Walmart coverage varied across the dataset. Each marketplace has its own enforcement mechanics, covered separately in Amazon MAP violations and Walmart MAP violations.
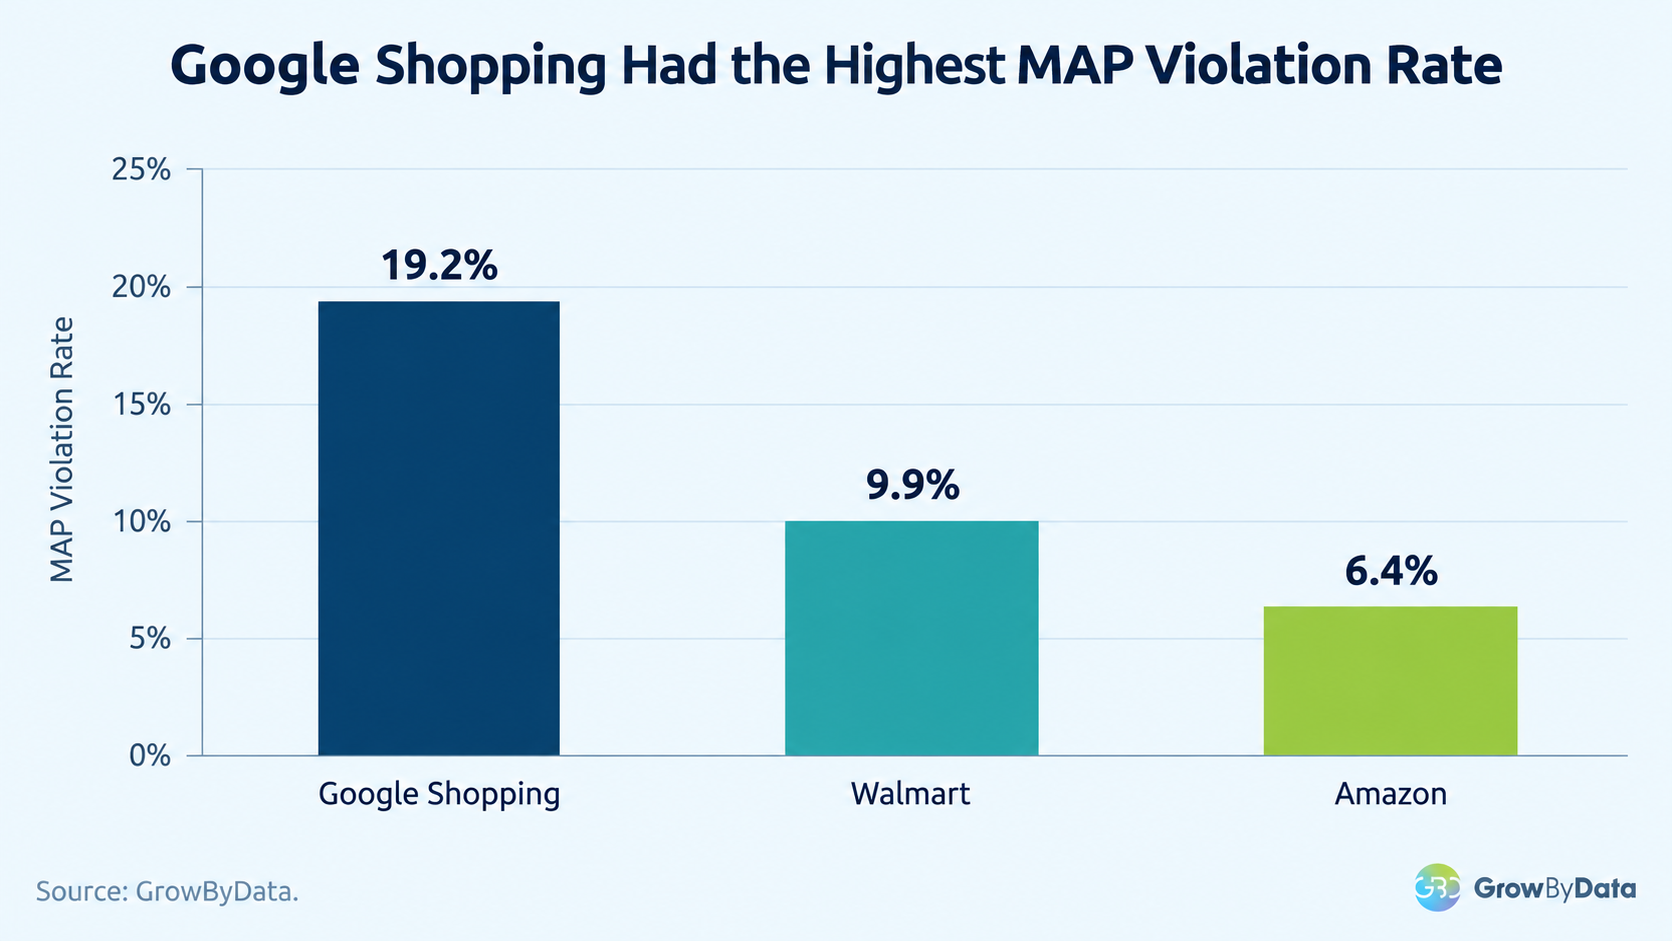
One Brand, Three Channels: 19.2% vs 9.9% vs 6.4%
One stationery brand was monitored across Google Shopping, Amazon and Walmart for the same 32-month period. On Google Shopping, 19.2% of its observations came in below MAP. Walmart was 9.9% and Amazon was 6.4%. The products and the MAP policy were identical on every channel, yet the Google Shopping rate ran three times Amazon’s. Comparing one brand across channels separates channel differences from differences in coverage.
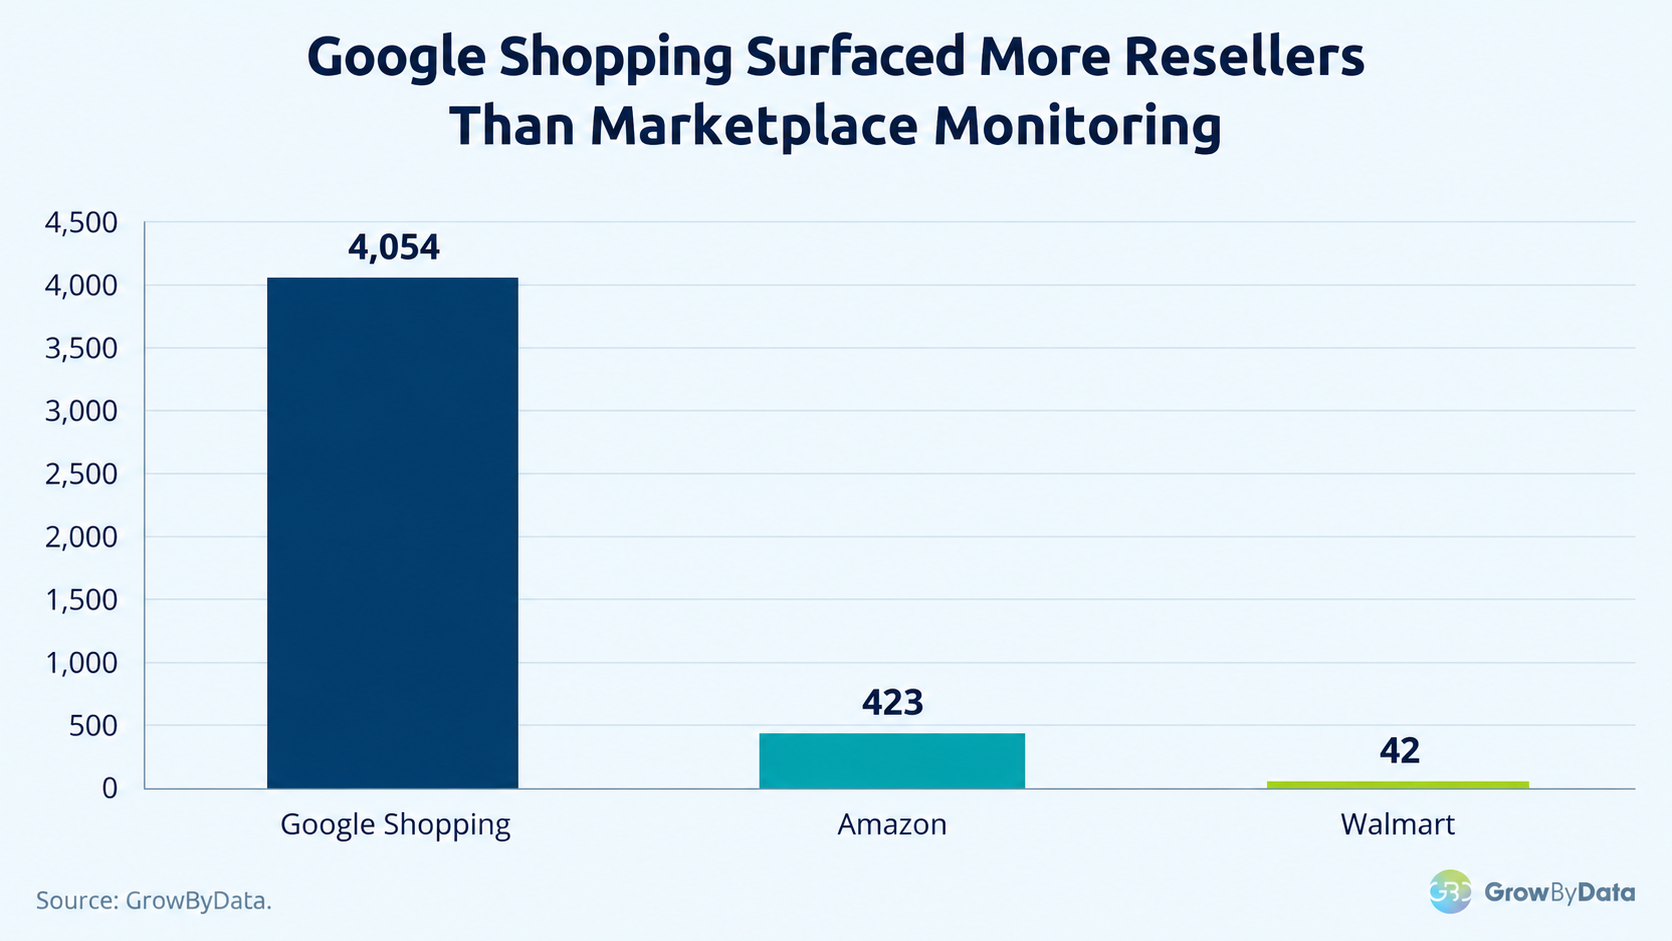
Google Shopping Shows More Sellers: 4,054 Resellers vs 423 on Amazon
Google Shopping gathers offers from independent retailers, marketplace storefronts and other resellers in one place. Google’s own documentation on how Shopping ads work notes that more than one offer can appear for the same search, each showing its price and store name.
Across the six brands analyzed:
- Google Shopping identified 4,054 distinct reseller names.
- Amazon monitoring identified 423 distinct reseller names.
- Walmart monitoring identified 42 distinct reseller names.
Price is a large part of why this matters. In independent analysis of Google’s organic product grids, a lower price is one of the factors that decides which seller gets shown first. That pressure applies to every seller in the grid, including the ones a brand has never heard of.
The Sellers Brands Can’t See: 98% Were Not Identified Under the Same Marketplace Name
Finding MAP violations is only part of enforcement. Brands also need to know which sellers are responsible, and whether those sellers are already visible through existing monitoring.
For four brands monitored across Google Shopping and at least one marketplace channel, GrowByData compared violating reseller names from Google Shopping against reseller names found through marketplace monitoring. About 98% of violating Google Shopping reseller names were not identified under the same name in marketplace monitoring.
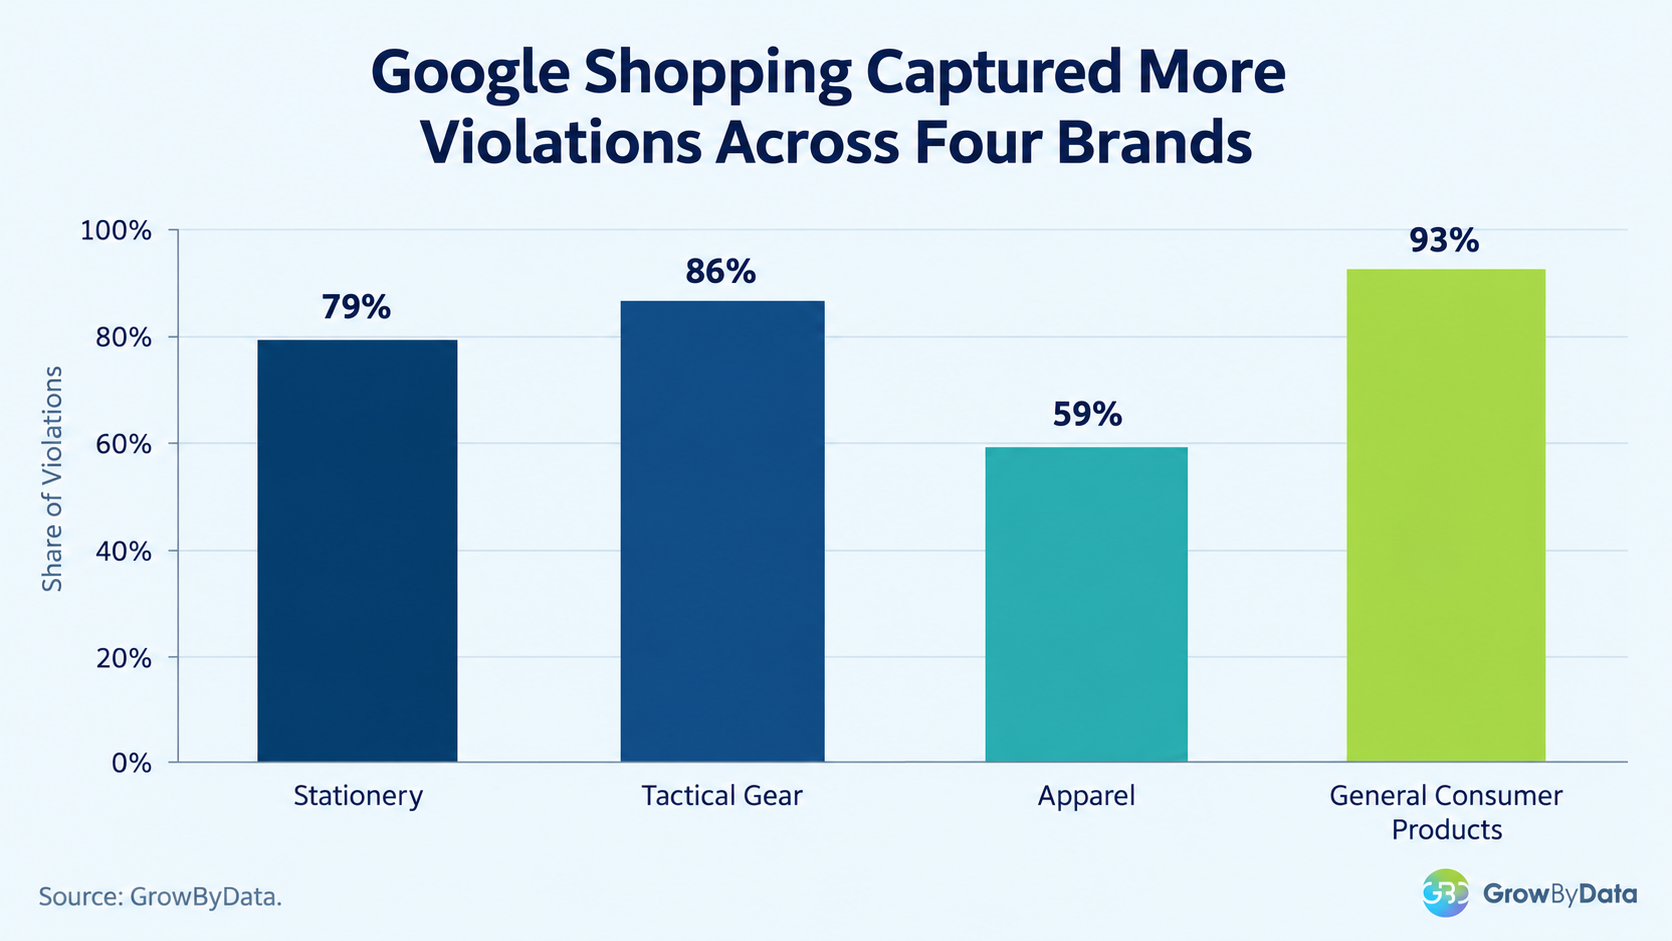
The same pattern appeared across product categories, with between 59% and 93% of each brand’s violations found on Google Shopping:
These sellers include independent retailers, regional dealers, specialty stores and marketplace storefronts that advertise products through Google Shopping. Checking retailer sites by hand won’t close that gap either, since no team is going to visit 4,000 sites every month. Our guide to detecting MAP violations across marketplaces covers how that discovery works in practice.
Repeat Violators Account for Most MAP Violations
Finding violations is the first step. The bigger challenge is identifying which sellers create the most ongoing pricing issues.
Across 1,731 violating reseller-brand combinations identified through Google Shopping, violations concentrated among a smaller group of repeat offenders:
- 590 reseller-brand combinations violated MAP in only one observed month, and together they account for less than 1% of all violations.
- 534 reseller-brand combinations violated MAP in six or more observed months.
- 223 reseller-brand combinations violated MAP in twelve or more observed months, and on their own they account for 60% of violations.
Among violating resellers seen in six or more months, 58% were below MAP in at least three of every four months they appeared. We’ve written separately about why MAP violations keep coming back after enforcement, and this data shows the pattern at scale.
A Small Group of Sellers Accounted for 94% of Violations
Reseller-brand combinations that violated MAP in six or more months accounted for approximately:
94% of recorded Google Shopping MAP violations
The concentration was even higher among the most frequent violators:
The top 10% of violating reseller-brand combinations accounted for 86% of violations, and the top 1% accounted for 40%.
These figures measure different aspects of concentration:
- 94% reflects the share of violations tied to reseller-brand combinations that repeatedly violated MAP over time.
- 86% reflects the share generated by the highest-volume 10% of violating reseller-brand combinations.
For brands, this means enforcement shouldn’t treat every violation equally. A seller caught once needs a different response from a seller advertising below MAP month after month. Enforcement does move some of them: of 807 violators we could follow for at least three months after their first violation, 31% later posted two or more consecutive compliant months.
Different behavior calls for different responses, from a reminder to a formal notice. Our guide to stopping MAP violators and rewarding compliant sellers sets out how to tier that. One stationery distributor used the same approach to reach a 39.5% reduction in MAP violations.
Tracking violation history helps brands prioritize:
- Sellers with recurring MAP violations
- Products most frequently affected
- Resellers contributing the highest number of violations
- Enforcement actions that need immediate attention
Persistent Violators: 854 Sellers Were Below MAP on Every Observed Check
Some reseller-brand combinations were below MAP throughout the monitoring period.
854 reseller-brand combinations were below MAP on every observed check
For these sellers, below-MAP pricing was the pattern rather than an isolated event. Historical violation data is what lets brands separate:
- Temporary pricing events
- Occasional MAP violations
- Repeated reseller behavior that needs further investigation
New MAP Violators Appear Every Month: About 71 of Them
New sellers enter categories, reseller strategies change, and pricing violations keep emerging. During the most recent 12-month period, Google Shopping surfaced approximately:
71 first-time violating reseller-brand combinations per month
To avoid overstating that trend, the calculation excludes each brand’s first three months of monitoring. This keeps newly added brands from appearing as a sudden increase in violations simply because monitoring had recently started.
MAP Violations Rise During the Holiday Season: 32.6% vs 27.3%
Violation rates moved with the calendar, running higher through the holiday shopping period.
| Period | Google Shopping MAP Violation Rate |
|---|---|
| November and December | 32.6% |
| Rest of the year | 27.3% |
The comparison uses the two brands with the longest continuous tracking history, which reduces the effect of changes in brand coverage over time. For those two brands, September was the worst month of the year at 41.1% and April the cleanest at 15.8%, so the case for tighter checks starts before the holiday season does. For the mechanics of sanctioned promotional windows, see managing MAP pricing during MAP holidays.
Marketplace Storefronts: 61% of Google Shopping Resellers Were Marketplace-Linked
Google Shopping surfaces more than traditional retailer websites. It also identifies sellers connected to marketplace and resale platforms.
Across the reseller names identified through Google Shopping:
- 2,476 reseller names were classified as marketplace storefronts, approximately 61% of all Google Shopping reseller names.
- eBay was the largest group, with 2,277 separate seller accounts, and 530 of those priced a tracked product below MAP at least once.
- Marketplace storefronts together produced about 12% of Google Shopping violations.
This data can’t show where a seller’s inventory came from. A storefront here could be a liquidator, a reseller buying from a leaky distributor, or an authorized dealer running a second shop. Seeing them is the first step toward finding out, which is where enterprise brand protection starts.
What the Data Means for MAP Programs
Effective MAP enforcement needs visibility beyond a fixed list of retailers and marketplaces. For the brands analyzed, Google Shopping surfaced a large number of reseller relationships that marketplace monitoring never identified under the same name. Four areas follow from the data:
Monitor at the Reseller Level
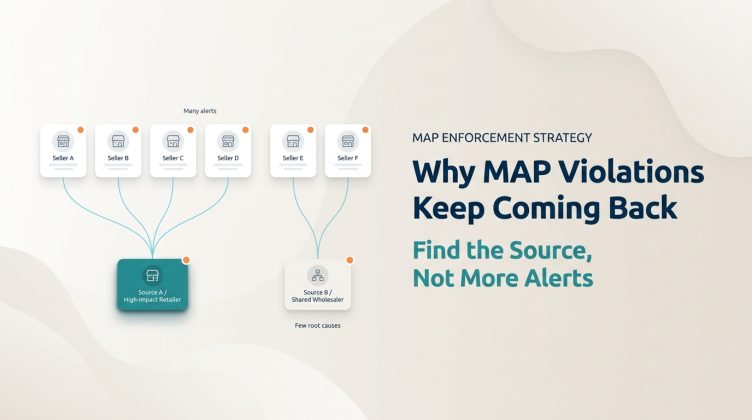
Tracking known retailers and marketplaces won’t capture every seller advertising a brand’s products. Reseller-level monitoring shows where products appear and which sellers need review, including the 98% that marketplace monitoring missed.
Prioritize Repeat Violators
Violations concentrate among a small group. With 86% coming from a tenth of the sellers, tracking violation frequency puts enforcement time where it changes the outcome. A MAP compliance audit is the fastest way to see where that concentration sits in a given reseller base.
Maintain Violation History
A single violation and a recurring one are different enforcement problems. Reseller and SKU-level history over time is what separates them, and it’s what turns a notice into a statement of fact: reseller, SKU, advertised price against MAP, and the date it was captured.
Increase Monitoring During High-Risk Periods
Rates ran about five points higher in November and December, and peaked in September. Checking more often ahead of those periods catches pricing changes earlier. For brands running this across a large reseller base, our guide to scalable MAP compliance covers how teams keep up without adding headcount.
How GrowByData Helps Brands Monitor MAP Compliance
Our MAP monitoring software tracks MAP compliance across Google Shopping, Amazon and Walmart at the reseller and SKU level.
Brands use MAP monitoring insights to understand:
- Which sellers are advertising products below MAP
- Which reseller-brand combinations repeatedly violate pricing policies
- Where additional reseller visibility is needed
For how detection and enforcement fit together, see our MAP monitoring guide. If you’re still defining what counts as a breach, start with MAP violations and your minimum advertised price policy. If you’re comparing vendors, we also compared 10 MAP monitoring platforms, including where each one falls short.
Understand Your MAP Visibility Gap
See where your products appear, which sellers are advertising below MAP, and which reseller relationships need attention.
How We Ran the Numbers
This analysis uses GrowByData MAP monitoring data across six consumer brands from January 2024 through August 2026. The dataset includes:
- Google Shopping monitoring across all six brands
- Amazon monitoring across four brands
- Walmart monitoring across one brand
- 617,958 reseller-SKU observations
One observation is one reseller offering one tracked SKU in one month on one channel. A MAP violation is an advertised price below the brand’s MAP value at the time of monitoring. Monitoring periods vary by brand, from 7 to 32 months.
Resellers are matched across channels by displayed reseller name, so a seller operating under different names across channels may appear as separate entities. Marketplace storefronts are classified from marketplace or resale platform indicators in the reseller name. First-time violator counts exclude each brand’s first three months of monitoring, so newly added brands don’t distort new-violator trends.