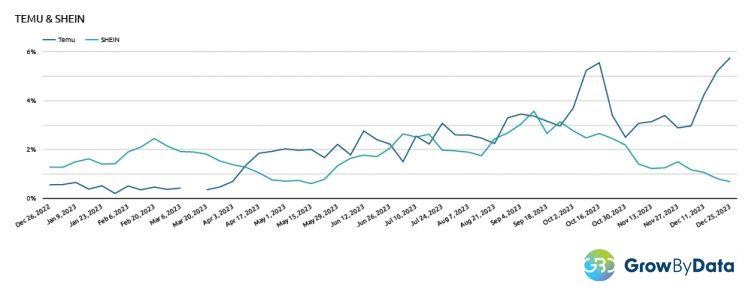
TEMU vs. SHEIN: 2023 Share of Voice Analysis by Category
In the dynamic world of online shopping, TEMU is emerging as a formidable competitor to SHEIN, signaling a potential shift in consumer preferences. Throughout 2023, SHEIN maintained an average Share of Voice (SOV) of 1.01% across all categories, while TEMU surpassed this with an average SOV of 1.8%. This development is particularly notable in specific categories:
- TEMU is rapidly gaining market share, trailing closely behind SHEIN in Apparel & Accessories (3.61% vs. 4.45% SOV).
- More strikingly, TEMU leads in Home Furnishings by a significant margin (2.18% vs. 0.18% SOV), suggesting a potential shift in this sector.
- Across Automotive, Beauty, and Musical Instruments, TEMU demonstrates a steady presence with SOVs ranging from 0.4% to 1.90%, while SHEIN’s involvement remains minimal.
TEMU experienced significant growth in SOV in the last quarter of 2023, while SHEIN saw a decline over the same period. These insights reveal TEMU as a significant player, especially in markets beyond Apparel & Accessories. Although SHEIN currently leads, TEMU’s rapid growth and broad category engagement demand attention. This analysis invites further exploration into consumer trends and strategic opportunities for both brands.
TEMU’s Share of Voice Analysis: Strong Apparel Presence with Surprising Spikes
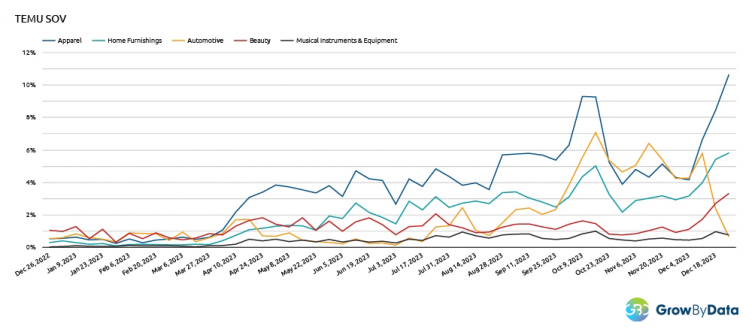
The data paints a compelling picture of TEMU’s Share of Voice (SOV) across diverse industries. While Apparel remains a stronghold with an average SOV of 3.61%, other sectors are showing promise:
- Automotive: With a SOV of 1.90%, TEMU is marking its territory in this non-traditional market, hinting at possible expansion plans.
- Home Furnishing: TEMU stands out with a strong SOV of 2.18%, indicating a strategic emphasis on this e-commerce segment.
- Beauty: TEMU’s moderate SOV of 0.92% suggests there’s potential for growth within this industry.
- Musical Instruments: A SOV of 0.42% suggests a more focused approach in this niche market.
To deepen our understanding, let’s analyze the graph provided: Between October 9-15 and 16-22, the Share of Voice (SOV) for Apparel surged to 9.3% and 9.27%, respectively. This upsurge may indicate targeted marketing efforts or special promotions during those periods. A detailed examination of the strategies implemented during these times could offer valuable insights into TEMU’s marketing approach. In summary, Apparel and Home Furnishings demonstrate a positive trend throughout the year, with Apparel’s SOV experiencing a notable upturn towards the end of 2023. On the other hand, the Automotive, Beauty, and Musical Instruments & Equipment categories exhibit much lower SOV, with Beauty displaying some volatility and a slight increase in the other categories towards the year’s end.
Untapped Territory: How Diversification Can Unlock SHEIN’s Growth Potential
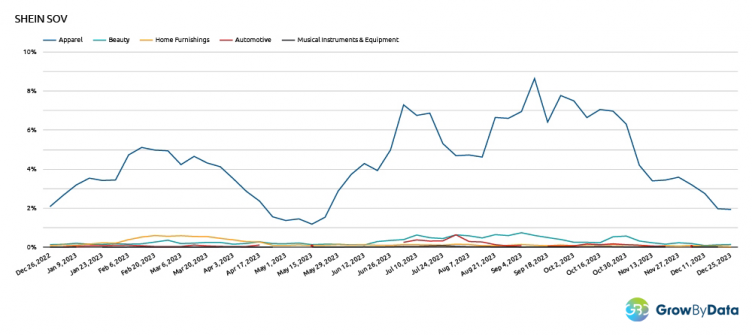
This data paints a picture of SHEIN as a dominant force in the apparel industry, boasting a commanding 4.45% SOV. Further highlighted by an impressive 8.65% peak during September 11-17, their marketing efforts in this domain are clearly effective. However, venturing beyond clothing reveals a different story.
SHEIN’s presence in other categories is noticeably limited:
- Automotive: 0.14% SOV
- Beauty: 0.31% SOV
- Home Furnishings: 0.18% SOV
- Musical Instruments: 0.016% SOV
By venturing beyond apparel, SHEIN can tap into new customer segments, increase market share, and mitigate risk associated with overreliance on a single category. This data is a valuable roadmap for unlocking their full potential. From this data, we can also infer that Apparel is the dominant category on SHEIN, with significant consumer interest, especially in the spring and early fall of 2023. The other categories do not experience such dramatic changes in SOV throughout the year.
TEMU vs. SHEIN: A Multi-Category Battleground Emerges – Conclusion
The 2023 Share of Voice (SOV) analysis paints a captivating picture of a potential shift in the e-commerce landscape. While SHEIN remains the apparel king with a 4.45% average SOV, TEMU’s impressive 1.86% average across all categories and its strong presence in diverse sectors signal a rising challenge.
Key Takeaways:
- Apparel remains a battleground: TEMU trails closely behind SHEIN in Apparel & Accessories (3.66% vs. 4.45%), suggesting intense competition in this core market.
- TEMU emerges in new territories: Home Furnishings (2.18% SOV) and Automotive (1.03% – 1.90% SOV) showcase TEMU’s potential beyond apparel, potentially challenging SHEIN’s future dominance.
- Diversification is key: While SHEIN currently leads, its limited presence outside apparel presents an opportunity for TEMU to capture a broader market share through strategic expansion.