Amazon Prime Days are a highly anticipated shopping event that offers exclusive deals to Prime members, often resulting in a significant spike in sales and online activity. Held annually, Prime Days have become a major fixture in the e-commerce calendar, with retailers and consumers alike preparing for the flurry of deals and discounts. As per CNBC news, a staggering $14.2 billion in online shopping was recorded between July 16 and July 17 which is an 11% increase comparatively.
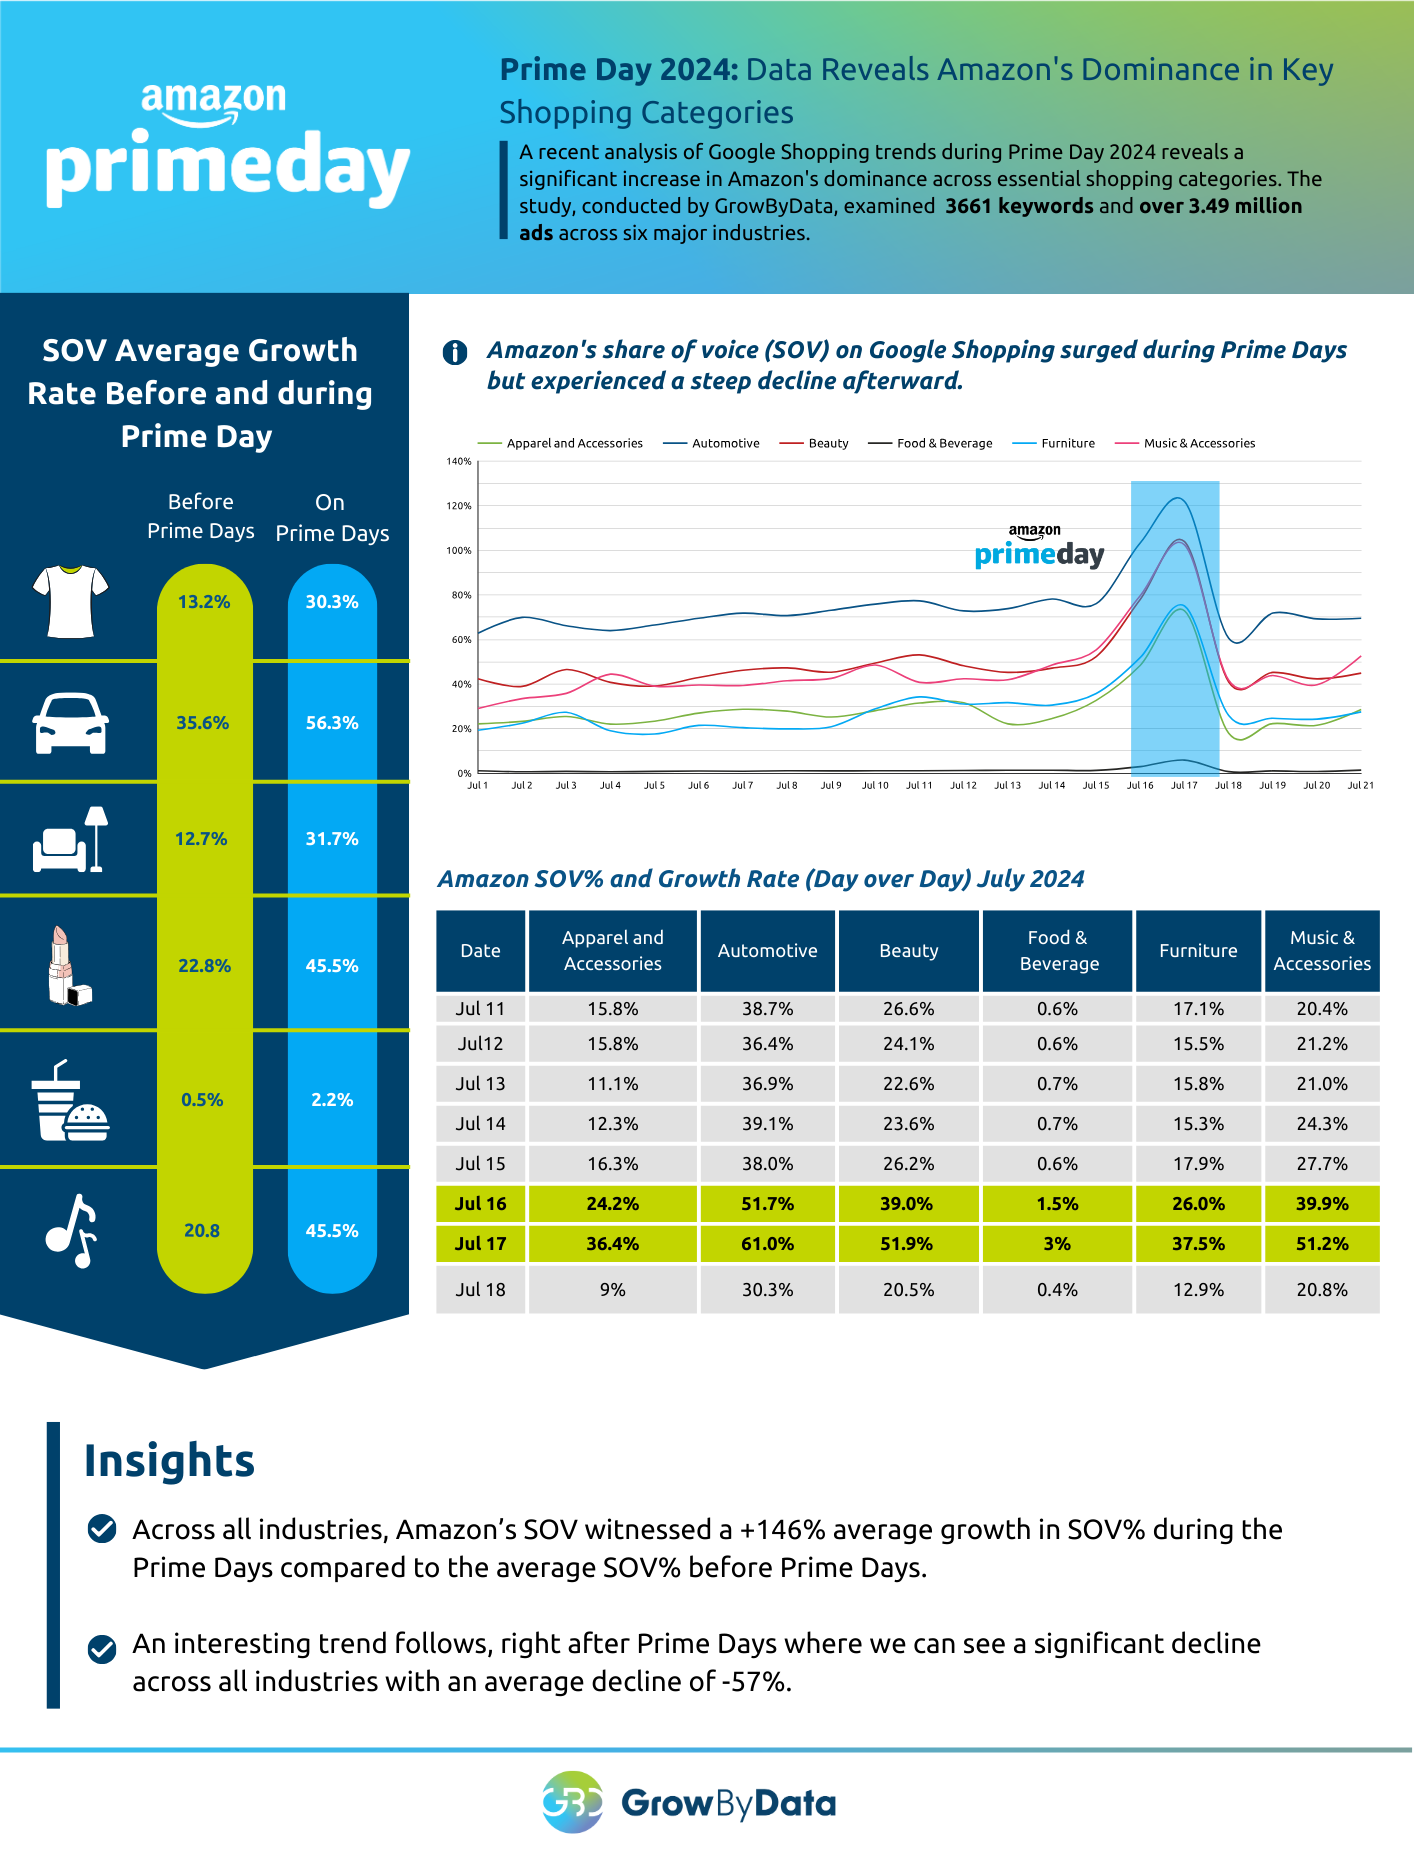
Even though Prime Day came and went in a flash, the data it left behind paints a fascinating picture of how Amazon strategically uses Google Shopping to dominate during its biggest sales event. To track this, we at GrowByData analyzed 3661 keywords and over 3.49 million ads across six key industries (apparel, automotive, furniture, beauty, food & beverage, and music) to see how Amazon’s share of voice (SOV) on Google Shopping changed throughout July, with a special focus on Prime Day (July 16-17).
Here’s what we found:
1. Overall Growth in SOV
Amazon’s average Share of Voice across all industries grew by an impressive 146% during Prime Days compared to the period before the event. This substantial growth underscores Prime Days’ impact on Amazon’s market presence. It reflects Amazon’s ability to capitalize on heightened consumer interest and drive significant traffic to its products.
2. Day-to-Day Comparison
When comparing the day before Prime Days (July 15) to the event days (July 16-17), there was a 52% average increase in SOV across all industries. This indicates a significant boost in Amazon’s presence even on a day-to-day basis.
3. Food & Beverage Industry Gains
The Food & Beverage industry experienced the most dramatic increase in SOV, with an average SOV of 0.5% before Prime Days jumping to 2.2% during the event. This represents a staggering 322% growth. The significant rise in visibility for this sector demonstrates the effectiveness of Prime Day promotions in driving consumer interest and purchases in this category.
4. SOV Growth in Other Industries
Prime Days also led to significant SOV(%) growth in other industries. For example
- Apparel & Accessories: +49% growth
- Automotive: +27% growth
- Beauty: +41% growth
- Furniture: +45% growth
- Music & Accessories: +36% growth
5. The Unexpected Twist: Post-Prime Day Slump
After Prime Days, there was a significant decline in Amazon’s SOV across all industries, with an average decrease of 57%. The most noticeable drop was in the Food & Beverage industry, followed by Apparel and Accessories with a 63% decline, and the Furniture industry with a 60% decline. However, the data uncovers a surprising twist.
So, What Does This Mean?
This data suggests a well-orchestrated advertising campaign by Amazon, specifically targeting Prime Day on Google Shopping. They likely amplified their ad spend, flooding the platform with deals and attracting consumer attention to their website. Once Prime Day ended, they likely adjusted their paid search strategy, focusing on converting those who interacted with their Prime Day promotions.

While Prime Day 2024 is a closed chapter, the insights remain valuable. Here’s what we learned:
- Prime Day is a goldmine for Amazon, and they leverage Google Shopping to maximize sales. This underscores the importance of strategic advertising during sales events.
- Consumers actively seek deals on Google Shopping during Prime Day. Retailers, especially in Food & Beverage, Apparel, and Furniture, have a golden opportunity to capitalize on this heightened consumer interest.
- Short-term, focused ad campaigns on Google Shopping can be highly effective for driving traffic and sales. This offers valuable guidance for retailers seeking to optimize their advertising strategies.
Additional Reading:
- Amazon October 2023 Members-Only Prime Day: Google Shopping Share of Voice
- Amazon Advertising Strategy on Google Shopping on July Prime Day 2023
- How TEMU is Challenging SHEIN’s Dominance


