Online shoppers are exposed to countless numbers & types of digital advertising, making it an extremely competitive landscape and difficult for brands to get noticed. If you’re trying to succeed on Google as a brand and win the digital shelf, it is crucial to take steps beyond measuring ROI and ROAS and start tracking Share of Voice (SOV).
Google is the largest platform in the world, and it makes sense to measure and increase your share of voice on it. Your Share of Voice on Google reflects the ability of your brand to be visible to the right audience. But there are thousands of other brands attempting to increase their share of voice on Google, and among them is a giant that competes in almost every category of products – Amazon.
As a brand, you should be tracking the share of voice of Amazon on Google as they can severely impact your own performance and visibility on the platform.
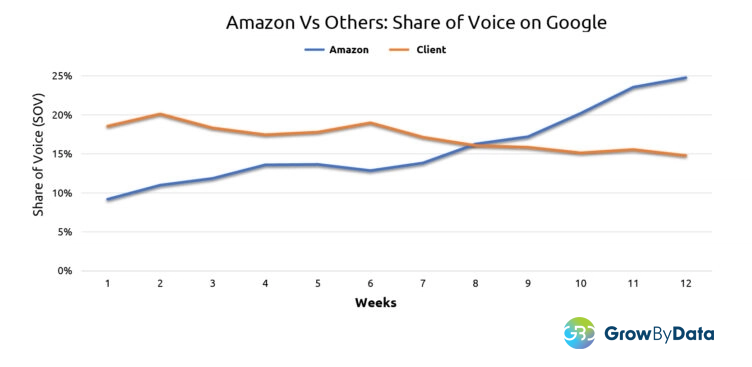
Our experts at GrowByData, using Search Intelligence software, monitored and analyzed the SOV of brands in several categories and compared them to Amazon’s share of voice in each category. As seen on the graph below, as Amazon’s share of voice increases, the SOV of other brands decreases. In the three months we collected the data, Amazon’s SOV rose by 144%, while the SOV of other brands decreased by 21% in the same period.
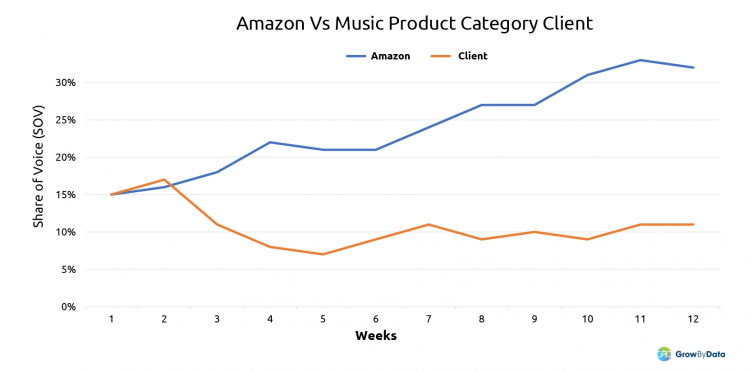
Only looking at the categorical data may be too general and may not reflect the whole story. So, we dove deeper into a client’s share of voice in the music product category to see how our client was faring against a seller like Amazon. We found that as Amazon’s Share of Voice in the category increased by 113% (15% to 32%) and our client’s SOV decreased by 27% (15% to 11%).
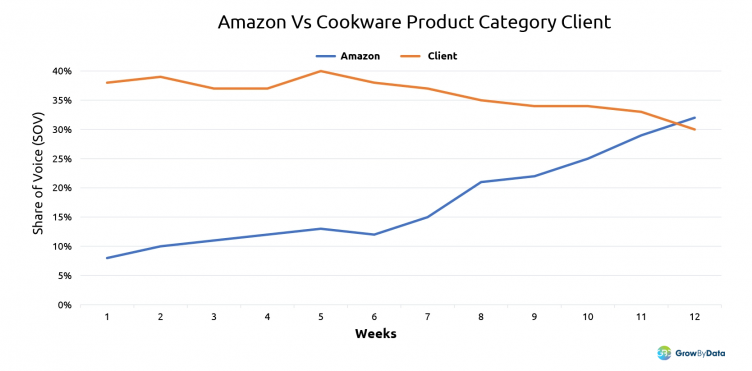
We also analyzed the data for our client in the cookware product category and found that at the beginning of March, they had a 38% SOV on cookware category keywords while Amazon only had 8% SOV in these category keywords. But, in the weeks that followed, Amazon rapidly increased its SOV in the category, and by the end of May (12 weeks later), it had a 32% SOV: an increase of almost 300%. During the same period, our client lost their SOV by 21%: it dropped from 38% down to 30%.
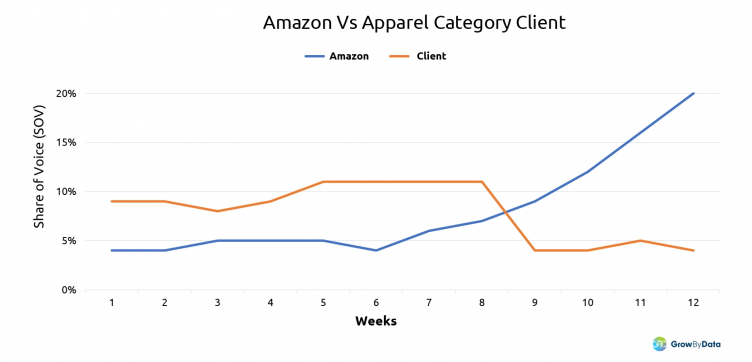
The third client’s data we analyzed against the share of voice of Amazon on Google was an apparel and accessories category client who saw their share of voice dive from 9% to 4% while seeing the Share of Voice of Amazon in the category rise from 4% all the way to 20%. As shown on the graph below, both Amazon and our client’s share of voice was steady up to the 6th week but after that, Amazon’s SOV started climbing up and a week after that, we see our client’s share of voice sharply decline.
Why you should be tracking and comparing your SOV with Amazon with Search Intelligence?
While we all know the importance of knowing your own SOV, it is also crucial to perform competitive research and analysis of Amazon’s SOV on Google to understand and gain answers to queries like:
- Keywords Amazon may be targeting
- Who is your biggest competition in paid ads and organic listings?
- What is working for Amazon that you can implement into your own marketing or advertising strategy?
- Where should your marketing budget be spent for maximum effectiveness?
Search Intelligence allows you to measure your Vs competitor’s share of voice by keywords, geolocation, search devices, SERP features, product categories, and other customized dimensions. Understanding Amazon’s SOV on particular keywords or products allows you to pivot your marketing campaigns and advertising strategies. For example, if Amazon is spending a lot on a keyword-based on an increase in their SOV for that keyword, then you can stop spending on ads and resources for that or remove it from the product feed as it is very difficult to beat Amazon with the resources they have. You can use that budget and resources in other areas to maximize your ROAS.
Our tool doesn’t just let you monitor and track Amazon’s Share of Voice but also your top and emerging competitors’ Share of Voice giving you an extra level of insight into your category and competition. This type of detailed data and granular insights gives you an edge to improve your SOV, impressions, and ad rank on the Google SERP.
Conclusion
By consistently tracking your SOV in comparison to Amazon’s SOV on Google, you can better understand your target demography, location, keyword, etc. It will also allow you to better gauge your market share in your industry or category among prospective and existing customers. Knowing your standing in the market puts you in a better position to experiment with new marketing and advertising campaigns and strategies to improve your performance over time.