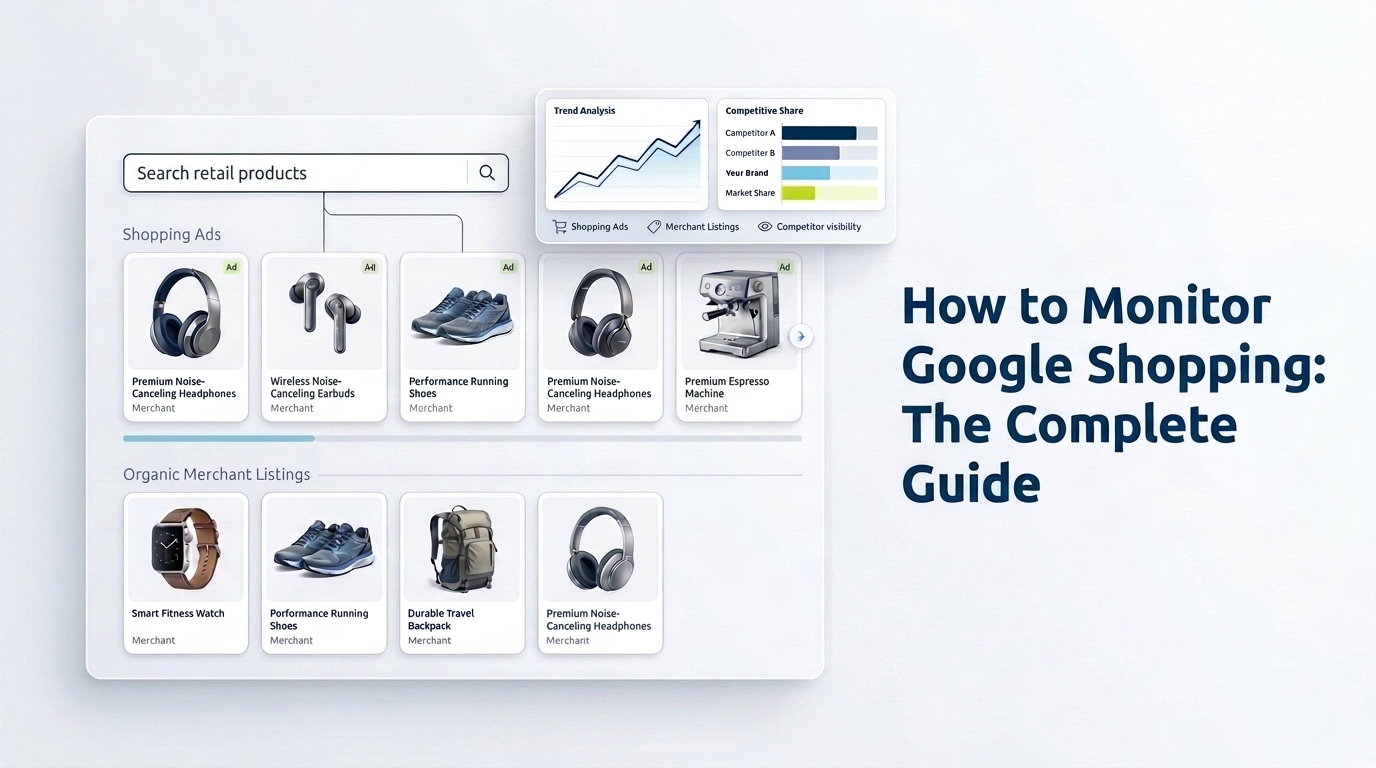
To monitor Google Shopping Ads, track where your Product Listing Ads and your competitors’ appear on the SERP, on a fixed keyword set, every week, and read them next to the organic Merchant Listings on the same results. Google’s account tools show what happened inside your campaigns. Monitoring shows what rivals did on the page.
Most Paid Search Directors think they’re monitoring Google Shopping Ads. They’re checking Auction Insights weekly, pulling Performance Max reports, maybe running a competitor price check once a month.
It feels like coverage. It isn’t.
The monitoring methods most enterprise teams rely on were built for a version of Google Shopping that no longer exists. They miss much of the competitive activity on the SERP, not because of tool quality, but because of how the data is captured.
By the time the gap shows up in your conversion data, a competitor has already taken the share.
This guide is also GrowByData’s Google Shopping hub. It covers how to monitor Shopping Ads and Merchant Listings at enterprise scale, and the library at the end collects GrowByData’s Google Shopping guides, benchmarks and tool reviews.
Start here
- What Google Shopping Ads monitoring means
- Why standard monitoring produces bad data
- What you need to monitor
- Merchant Listings, the organic half of Google Shopping
- How to build a monitoring workflow at enterprise scale
- Google Shopping library: monitoring, how Shopping Ads work, organic listings, and benchmarks
What Google Shopping Ads monitoring means
Google Shopping Ads monitoring is the ongoing tracking of where Product Listing Ads appear in Google SERPs (yours and competitors’) across a defined keyword set, measured by share of voice, merchandising signals, and SERP feature context.
Not a one-time audit. Not a monthly report. A continuous competitive intelligence layer.
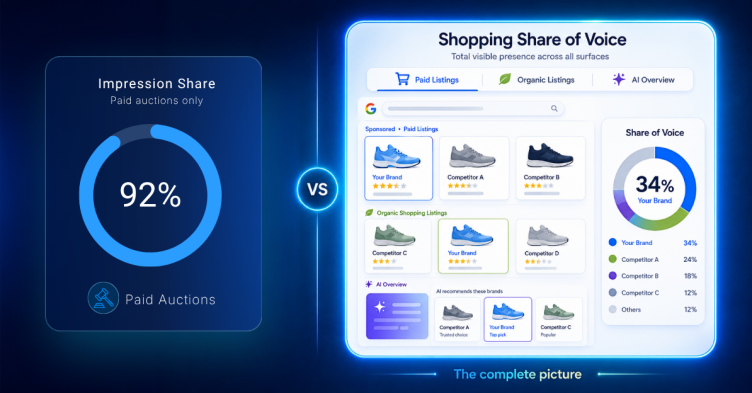
That definition matters because most teams confuse monitoring with reporting. Google’s own tools (Auction Insights, Performance Max dashboards, Merchant Center diagnostics) tell you what happened inside your account.
They don’t tell you what competitors are doing on the SERP, which keywords are becoming more competitively dense, or whether a rival brand just switched to an aggressive discounting strategy. That’s what monitoring is for.
The distinction between account reporting and SERP monitoring is where most enterprise teams have a gap. Understanding why that gap exists starts with how Shopping Ads data is captured. For how Shopping Ads visibility has changed over the past two years, read Google Shopping Ads in a changing visibility landscape before going deeper here.
See what your current Shopping monitoring is missing
Bring your category keywords and named competitors. A GrowByData Compass audit shows who holds Shopping Ads and Merchant Listings share on those terms, in your chosen markets and devices.
Why standard approaches produce bad data
Why do different tools report different Google Shopping Ads visibility?
The honest answer: because they’re capturing different SERPs. And the gap between them is larger than most teams realize.
GrowByData tracks Shopping Ads across retail keyword sets using both logged-in account-based scraping and standard automated logged-out crawling. Across the same retail keyword set and time period, logged-in tracking shows Shopping Ads appearing at 15.1% average SOV. Standard automated logged-out tracking of the same period shows Shopping Ads at under 0.3% presence.
That’s not a rounding difference. Standard monitoring is capturing less than 2% of the Shopping Ads activity a real retail shopper sees.
What data do Google Shopping Ads tools miss?
Three structural failure modes explain this:
- Logged-out scraping misses personalized Shopping carousels. Google increasingly serves Shopping Ads based on user signals: browsing history, account data, purchase patterns. An anonymous crawler gets a heavily filtered view of the SERP. The Shopping carousel a logged-in retail shopper sees is substantially richer than what an unauthenticated bot captures. This isn’t a configuration issue, and no amount of proxy rotation fixes it.
- Auction Insights only shows competitors in your auctions. If a competitor is bidding on high-intent category keywords you’re not actively targeting, they’re invisible to Auction Insights entirely. You’re not losing share you can see. You’re losing share you can’t. This is particularly acute for brands that have pulled back on broad-match Shopping campaigns.
- Keyword scope determines what you find. Most automated monitoring tools sample a broad keyword set at low frequency. A wide net at low resolution misses the competitive concentration on specific high-converting queries. The keywords where competitors pour budget cluster around commercial intent terms that need dedicated monitoring, not a statistical sample.
The result is a monitoring setup that feels functional but produces a distorted competitive picture. For the full breakdown, read the Google Shopping Ads blind spot, explained.
What you need to monitor
How accurate is Google Shopping Ads share of voice reporting?
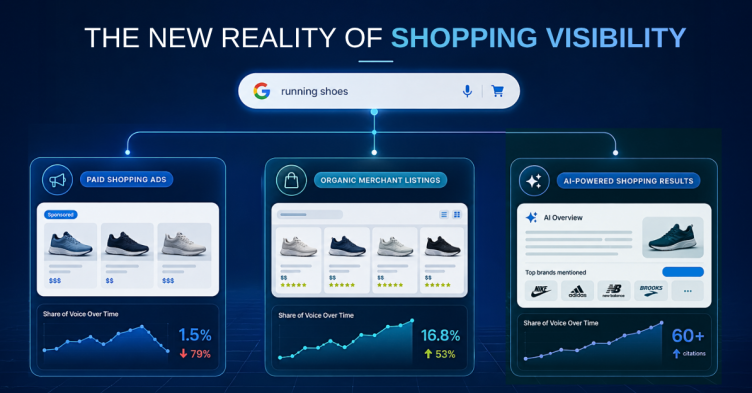
It depends entirely on what’s being measured and how. SOV is the right metric, but only when it’s derived from logged-in, profile-matched SERP captures across a keyword set weighted toward commercial intent. Here’s what that SOV picture looks like across a retail keyword set tracked by GrowByData:
| SERP surface | Avg SOV (logged-in retail SERP) | Avg SOV (weekly range) |
|---|---|---|
| Merchant Listings (organic Shopping) | 23.8% | 16.8% to 29.2% |
| Shopping Ads (paid PLAs) | 15.1% | 7.3% to 23.5% |
| AI Overview | 8.3% | Varies |
| Organic (10 blue links) | 8.4% | Varies |
Two things jump out of that table. Merchant Listings (the organic Shopping surface) has higher average SOV than paid Shopping Ads. Most teams fund their paid program aggressively and underinvest in organic Shopping, and the data suggests that’s backwards for at least some of the SERP.
Shopping Ads SOV also swings from 7.3% to 23.5% week over week. A monthly snapshot misses those peaks and troughs, which is exactly when competitive opportunities open and close.
Here are the five signals a complete monitoring setup needs to track:
- Shopping Ads SOV by competitor, week over week. Not just whether ads appeared, but who’s winning share and by how much. A competitor scaling SOV from 8% to 18% on your core category keywords over three weeks is a strategic signal, not noise. Google Shopping share of voice explains how to measure it beyond impression share.
- Merchant Listings alongside Shopping Ads. These are separate competitive surfaces with separate winners. A brand dominating your paid Shopping landscape may be losing the organic Shopping battle, or the reverse. See Google Shopping organic listings for why this surface is increasingly competitive.
- Annotation and merchandising signals. Price drop badges, sale tags, shipping labels and product ratings directly affect click-through on Shopping carousels. Knowing a competitor switched to aggressive price-drop annotation before it shows up in your own conversion data is the whole point. The guide to Shopping Ads extensions and annotations covers what each label signals.
- Weekly cadence as the minimum. Shopping Ads SOV swings by more than 16 percentage points across a typical eight-week period. Monthly monitoring treats that volatility as background noise. Weekly tracking treats it as signal, which it is.
- SERP feature co-occurrence. When Shopping Ads appear on the same SERP as an AI Overview (AI Overviews held 8.3% SOV on logged-in retail SERPs in this dataset), the click dynamic changes. Monitoring Shopping Ads in isolation misses what else is competing for the click. How Shein and Quince dominated apparel Shopping Ads shows what happens when brands treat SOV as a standalone metric.
Merchant Listings appeared on 85% of retail SERPs in our panel
In the GrowByData Retail Industry Panel, Merchant Listings appeared on 37,960 of 44,605 desktop SERP checks (85.1%) and 37,949 of 44,516 mobile checks (85.2%) from October 19 to November 17, 2026. That makes organic Shopping one of the most common features on US retail results. Any Shopping monitoring plan that skips it is reading half the shelf.
Merchant Listings are the unpaid product results Google builds from Merchant Center feeds and structured data. They sit beside or below Shopping Ads, with different winners, so they need their own share of voice line. Our view: report paid and organic Shopping in the same weekly view, and give each its own owner.
Three guides cover the organic side in depth: how to rank in Google Merchant Listings, Google Shopping organic listings vs paid ads, and fixing Google Merchant Center errors.
How to build a monitoring workflow at enterprise scale
How do I track Google Shopping Ads visibility?
Most teams answer this question by buying a tool. The tool isn’t the hard part. The workflow is.
The four-step structure below connects monitoring data to decisions:
- Define your keyword set by intent tier. Not all retail queries show Shopping Ads equally. High-intent transactional queries (branded competitor terms, category plus modifier combos, SKU-level searches) show materially higher Shopping Ads presence than broad informational queries. 200 well-chosen transactional keywords give you more actionable competitive signal than 2,000 loosely themed ones.
- Set your capture method deliberately. Use logged-in, profile-matched scraping for Shopping Ads specifically, because the data gap versus logged-out automated crawling is too large to ignore for this surface. Standard automated tracking works for broad SERP feature presence at scale. The two methods answer different questions and should run in parallel.
- Build a baseline before you optimize. The first four weeks should be baseline-building, not action-taking. You need to know what normal looks like (typical SOV ranges, seasonal patterns, which competitors are always present versus sporadically active) before a week-over-week shift means anything. An alert threshold set without a baseline is a guess.
- Define the action protocol before you launch. Who receives the weekly SOV report? What SOV shift triggers a bid review? What competitor annotation change triggers a merchandising response? The teams that get ROI from Shopping Ads monitoring have a defined owner and a defined action path. A dashboard nobody checks is just infrastructure cost.
For a side-by-side of the platforms that support this workflow, see our review of Google Shopping monitoring tools. For the competitor side, see Google Shopping competitor analysis.
What good monitoring enables strategically
The operational case for Shopping Ads monitoring is simple: see what competitors are doing before it hits your numbers. The strategic case is bigger.
- Competitive response speed. Seeing a competitor scale Shopping Ads SOV on your core category keywords before it shows up in your own conversion data means you can respond in the same budget cycle, not the next one. In retail, where SOV shifts of 8 to 10 percentage points can happen in a single week, that lag is the difference between defending share and recovering it.
- Budget defense and opportunistic capture. When a competitor pulls back (seasonal budget resets, end of quarter, promotional lulls), SOV doesn’t disappear. It redistributes. The brands watching weekly are positioned to capture it at lower CPCs. The brands checking monthly find out after the window has closed.
- The organic vs paid allocation conversation. Merchant Listings averaging 23.8% SOV against Shopping Ads at 15.1% in logged-in retail SERPs tells a VP of Ecommerce something specific: organic Shopping is a bigger surface than paid Shopping on much of the keyword set. Most enterprise organizations fund paid and underinvest in organic Shopping, and monitoring data makes that imbalance visible.
That last point tends to open conversations at the CMO level that pure paid-search reporting can’t. The point of the data isn’t only to report last week’s SERP. It’s to give the people making budget decisions a clearer competitive picture than their counterparts have.
GrowByData is a search and AI visibility intelligence company for enterprise brands, retailers and agencies. Google Shopping monitoring in GrowByData Compass tracks Merchant Listings and Shopping Ads share of voice across your keyword set. Google Shopping Ads monitoring adds competitor PLAs and annotation signals, with logged-in capture for the Shopping Ads surface.
Google Shopping library: GrowByData guides, benchmarks and tool reviews
Our Google Shopping guides and research, grouped by the job you’re doing.
Monitor Google Shopping visibility
- Google Shopping share of voice: what it measures and why impression share isn’t enough.
- Google Shopping monitoring tools: six platforms compared, with strengths and limits.
- Google Shopping competitor analysis: tracking PLA share of voice against named rivals.
- The Google Shopping Ads blind spot: why standard tracking misses Shopping Ads activity.
- Why Google Shopping data no longer reflects reality: where account reports stop explaining results.
How Shopping Ads work and how to improve them
- How Google Shopping Ads work: the ranking factors behind PLA placement.
- Google Shopping Ads extensions: annotations, badges and what each one signals.
- Shopping product title optimization: best practices for product titles.
- Maximize ROAS on Google Shopping: strategies for return on ad spend.
- Monitor the price competitiveness of ad campaigns: three ways to watch price competition.
- Price competition and lower CPC on Google PLAs: how pricing affects listing ad costs.
- Fixing Shopping ad anomalies: catching campaign problems early.
- Regional ad intelligence for Google Shopping Ads: how Shopping Ads differ by market.
Organic listings and Merchant Listings
- Google Merchant Listings: how to rank in nine steps.
- Google Shopping organic listings and the digital shelf: the unpaid Shopping surface explained.
- Organic listings vs paid ads: the gap between the two Shopping surfaces.
- Google Merchant Center errors: why feeds alone won’t fix product rejections.
Benchmarks and agency use cases
- Google Shopping visibility: Q2 2026 benchmark report.
- The apparel brands dominating Google Shopping Ads in Q1 2026.
- How agencies win retail clients with Shopping intelligence.
Related GrowByData hubs and guides
- MAP monitoring guide: price violations on Google Shopping and marketplaces.
- Google SERP features: every feature competing with Shopping results for the click.
- AI shopping visibility: tracking products in ChatGPT and Google AI Mode shopping answers.
Google Shopping monitoring FAQ
What’s the difference between Google Shopping Ads and Merchant Listings?
Shopping Ads are paid Product Listing Ads that advertisers bid for. Merchant Listings are unpaid product results that Google builds from Merchant Center feeds and product data. They appear on many of the same retail searches but have different winners, so each needs its own share of voice measure.
Can you see competitors’ Shopping Ads without being in their auctions?
Yes, through SERP monitoring. Auction Insights only lists competitors in auctions you entered. Monitoring a keyword set captures every advertiser that appears on those results, including rivals bidding on terms you don’t target.
How many keywords should you monitor for Google Shopping?
Start with a few hundred transactional keywords weighted toward commercial intent, not thousands of loose ones. Our view: 200 well-chosen category, competitor and SKU-level terms give a clearer competitive signal than a broad sample checked rarely.
Does Google Shopping monitoring cover AI Overviews and AI Mode?
It should, because AI Overviews and AI Mode now show products on many retail searches. GrowByData Compass tracks Google AI Overviews and Google AI Mode next to Shopping results. See tracking AI Overviews in Shopping and product search for how that works.
Make your next budget call with the full Shopping SERP
Most Shopping monitoring setups have a structural blind spot. Book a GrowByData Compass demo to see Shopping Ads and Merchant Listings share of voice on your own keyword set, in your chosen markets and devices.