Over the years, Google has continually optimized its search algorithm to provide relevant search results to the user and improve overall click-through rates and conversions on its platform. Thus, it is a no-brainer to see how important it is for Google to display ads pertinent to the location of the search user. Also, Google constantly customizes search results and rankings across desktops and mobile devices. With the ever-changing algorithm, excelling in Google ads continues to be extremely complex.
Therefore, cross-device cross-time visibility at a regional level on Google Ads is essential for retailers. With this data, advertisers can get insights into questions such as –
- Who are my major competitors at a national, regional, and metro level?
- What keywords do I appear on by region?
- What is my regional ad rank on PLA Ads?
- What time of the day is most competitive to advertise and vice versa?
With these views, advertisers can develop location-based time-based ad campaigns to maximize Return on Ad Spend.
To better understand this category, we leveraged our Google Shopping Monitoring and analyzed Google Shopping Product Listing Ads (PLA) data on wine and liquor keywords for the last few months. Per, Google Keyword Planner, these 28 keywords have approximately 4 million total monthly impressions. We collected data from 4 different regions of the United States [Virginia, Ohio, California, and Oregon] three times a day [7 am, 11 am, and 3 pm ET].
Across this analysis, we identified 15K distinct shopping ads from 154 advertisers in the top 5 positions. Analyzing these ads by region and device gave us the following notable insights.
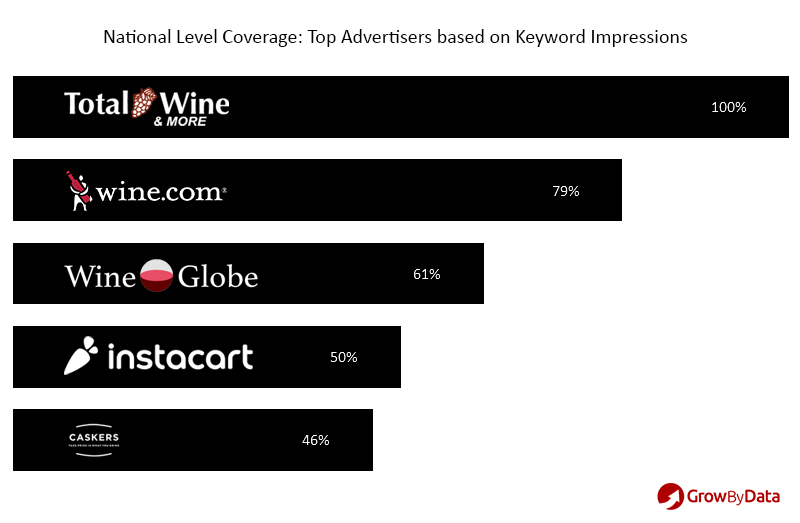
1. Top Advertisers by Keywords Coverage
In aggregate, Total Wine & More appears to be leading this category and was visible on all auctions we analyzed, followed by Wine.com, Wine Globe, Instacart, and Caskers.
Graph #1
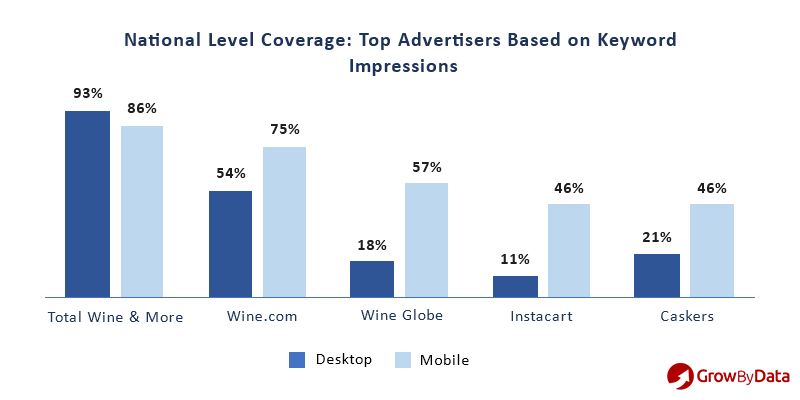
When we dug a little deeper into advertising penetration by device, we found that with the exception of Total Wine & More, all other retailers are getting more impressions from mobile devices than desktops as shown in graph #2 below. This means that there is more opportunity for growth for the other four companies when it comes to increasing ad visibility on desktops.
Graph #2
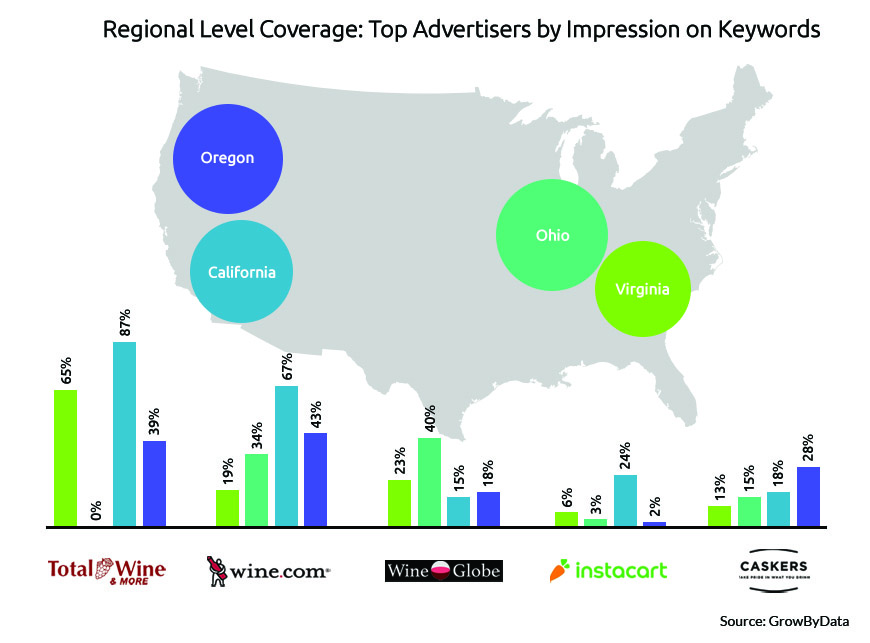
Analyzing further to the regional level, Total Wine has very low visibility in the Ohio region. The data shows the fluctuating ads impression by region. Though these top 5 retailers are leading in these competitive keywords nationally, the regional analysis shows areas they can improve on regionally.
Graph #3
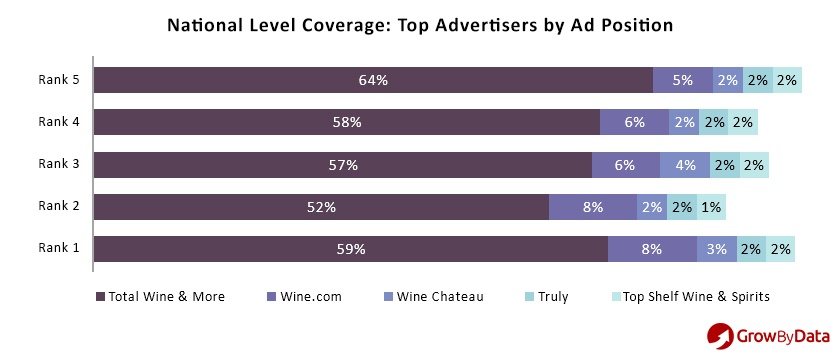
2. Top Advertisers by Ad Spot
The data below shows the Top 5 Advertiser’s Ad Coverage by Ad Rank/Position. 59% of Total Wine Ads are found in the first ad position and leading this chart by a big margin. Wine.com with 8% is second in the ranking race. The advertiser looking to compete in these keywords must improve quality scores and bid adjustments to win these key Ad Spots from competitors like Total Wine & More and Wine.com. The ads’ content analysis will be key to optimizing the quality score for these keywords.
Advertisers with less ad visibility need to pick and choose their spots for their ad spend (i.e. region, device, etc.) where Total Wine & More has gaps. It would be difficult to outspend a larger competitor like Total Wine, who most likely has a much bigger Ad spend budget.
Graph #4
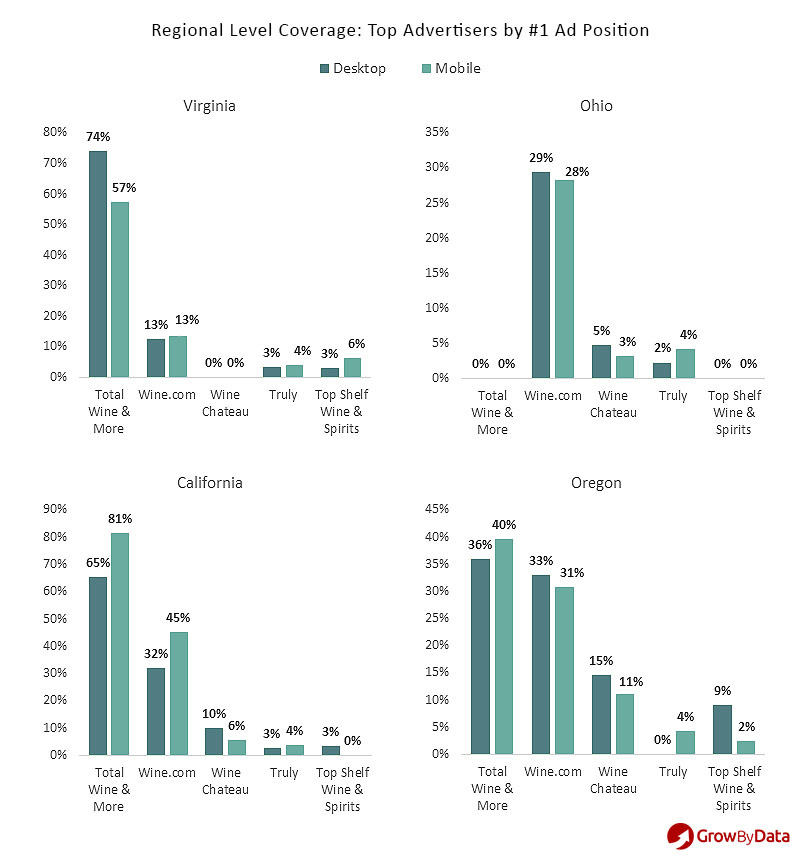
However, regional ad intelligence analysis shows the advertisers’ opportunity to capture key Ad Spots while also pointing out improvement areas for current top Advertisers. Although Total Wine is leading in three of the four regions and scoring the highest percentage of ads in the first position on both Desktop and Mobile devices, they have much lower ad visibility in the Ohio Region. The data shows Total Wine has no ads impression in the first position in the Ohio Region which could be an opportunity for challengers to take advantage.
Graph #5
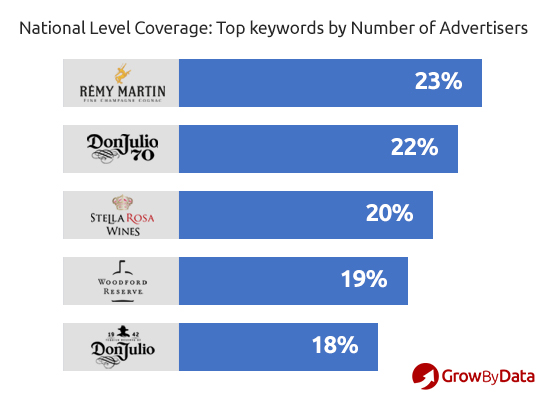
3. Top Keywords by Advertisers %
Not surprisingly, the specific wine and liquor names are the top keywords for this industry. Graph #6 below shows the top five competitive keywords from the list. This competition analysis is based on the number of distinct advertisers found in the top 5 positions for these keywords. Nationwide, “remy martin” is the keyword where the highest percentage (23%) of advertisers are found competing.
Graph #6
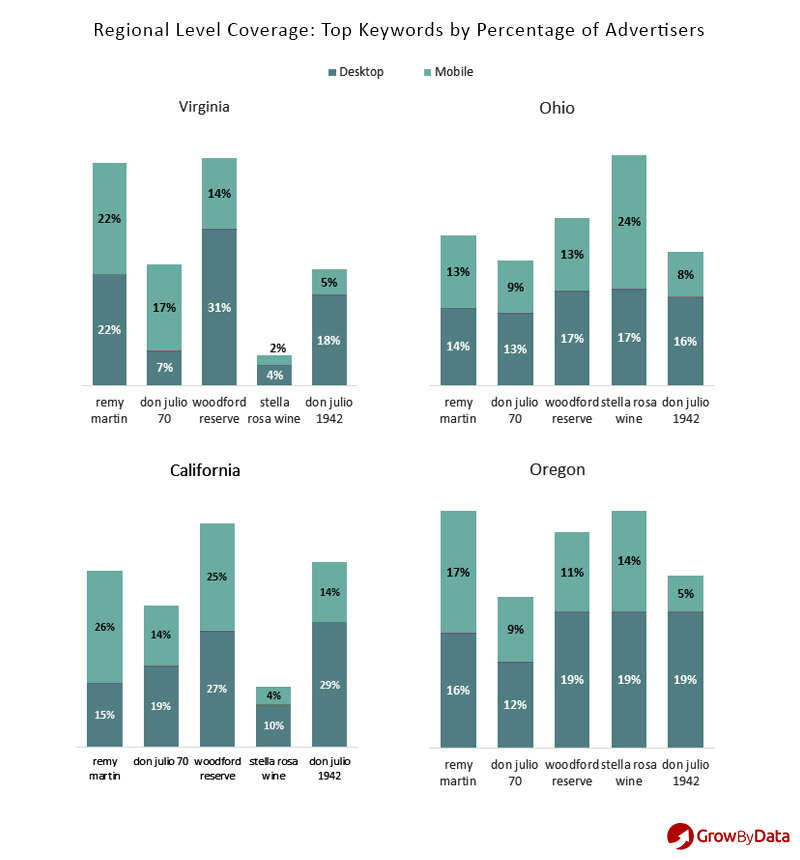
The keyword competition on a regional level is slightly different, as shown in graph #7 (below).
The keyword “stella rosa wine” is the most competitive in the Ohio region, although it is the least competitive in the Virginia and California regions where “woodford reserve” takes the lead.
Graph #7
4. Product Listing Ad (PLA) Coverage Competition by Time and Region
Stepping back and looking at the times of the day when ads appear the most, we found the following:
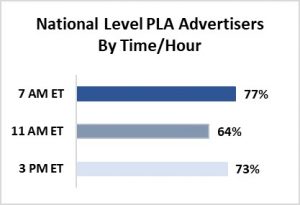
- The most competitive time nationwide is 7 am ET, with 77% of the advertisers visible on product listing ads.
- The least competitive time is 11 am ET, with only 64% of advertisers visible.
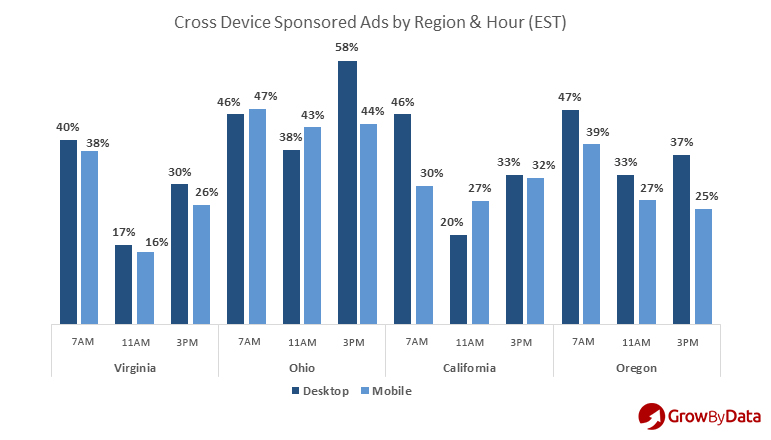
For the regional competition, we see from graph #8 (below) that:
- On desktops, the Ohio region at 3 pm ET is the most competitive region, with 58% of advertisers visible.
- On mobiles, the Ohio region at 7 am ET is the most competitive for mobile ads, with 47% of advertisers.
The Ohio region looks to be the most competitive overall, with more than 38% of the advertisers visible at all three times across devices.
- 11 am ET in the Virginia region has only 16% of advertisers visible on mobile and 17% on desktops. This also shows that the Virginia region has the lowest competition at 11 am ET across all four regions.
Graph #8
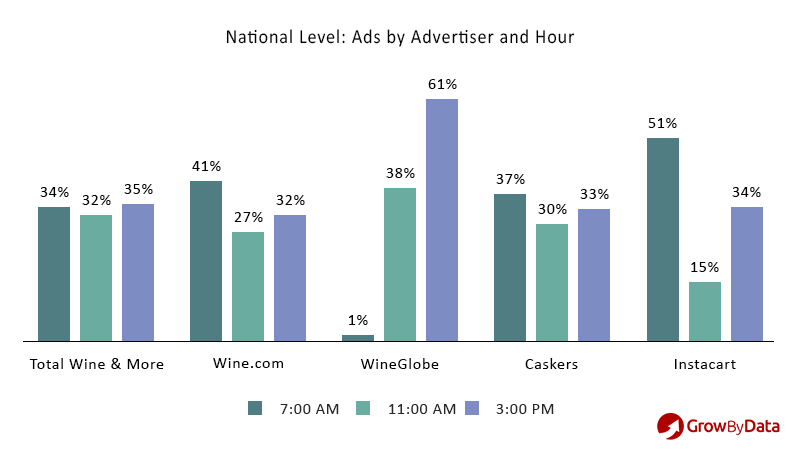
Graph #9 (below) shows us that each of the top 5 advertisers has different ad strategies. Total Wine & More ads are seen almost evenly spread between 7 AM, 11 AM, and 3 PM. Instacart, Caskers, and Wine.com look to be focusing more of their ads at 7 AM. But Wine Globe looks to be directing most of their ads around 3 PM. They are almost non-existent during the morning at 7 AM.
Graph #9
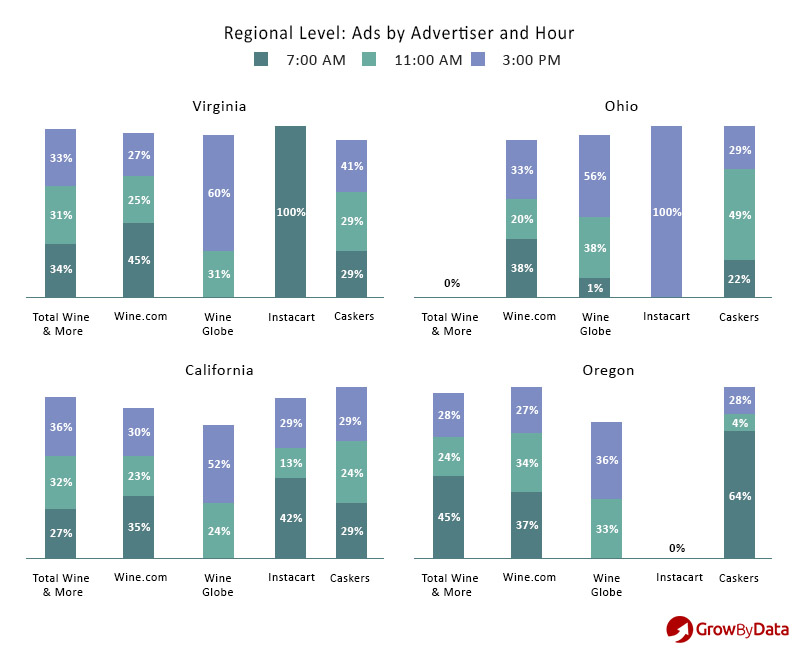
In Graph #10 (below), we break down the advertisers by ads’ times to a regional level. We found the results to be much different compared to the national level. Total Wine & More has ads almost evenly spread between the three hours in all the regions except Ohio where they have no ads during these times. This could be an area of opportunity for them during these times. Instacart looks to be focusing all of its ads at one time in the Virginia region (7 AM) and Ohio region (3 PM). We know that the least competitive hour in the Virginia region is 11 AM from the graph above (#8). So, a company like Instacart could possibly improve its ad visibility by focusing their ad spend during 11 AM in Virginia rather than 7 AM.
Graph #10
From the above analysis and graphs, we see that some ads that are ranked high on a specific keyword in one region can perform poorly on the same keyword in another region. Advertisers can leverage data like this to make sure what’s actually happening on the Search Engine Result Page (SERP) matches their ad strategy. They can also use it to identify areas where their biggest competitors might be weak, so they can push harder there and avoid getting into a bidding war.
To summarize, the Ad Intelligence tool provides an in-depth Ads Competition Landscape, to improve your Ads Campaigns. Below are a few takeaways and suggestions from the analysis.
- Analyze your ad dynamics regionally – where your competitors are advertising, where they are spending the most, and how you rank vs competitors across regions.
- Consider allocating more Ad Spend on the least competitive hour with high returns.
- Cross-device targeting is also crucial these days and should be part of your strategy. The regional breakdown will give an added edge to optimize your Ads. Advertisers with lower ad visibility should consider increasing ad spending more in areas where the leader is absent or weak.